Blog

  • Methods of Cataloguing — From Product Visibility to Visual Storytelling

    Project Development

    Week 1 ↗

    Testing three ways to compare 26 trade-card images: grouping them by subject, sorting them by product visibility, and comparing originals with cropped details.
    Week 2 ↗

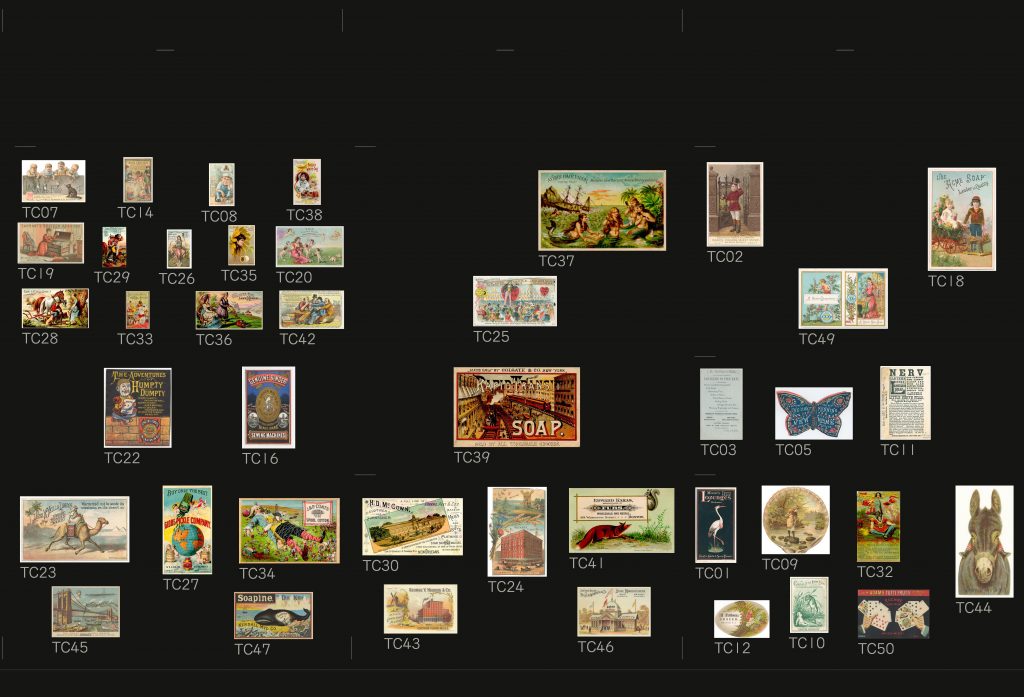
    Expanding the set to 50 trade-card images and arranging them in a grid to compare how clearly each product is shown and what draws the eye in each advertisement.
    After Feedback ↗

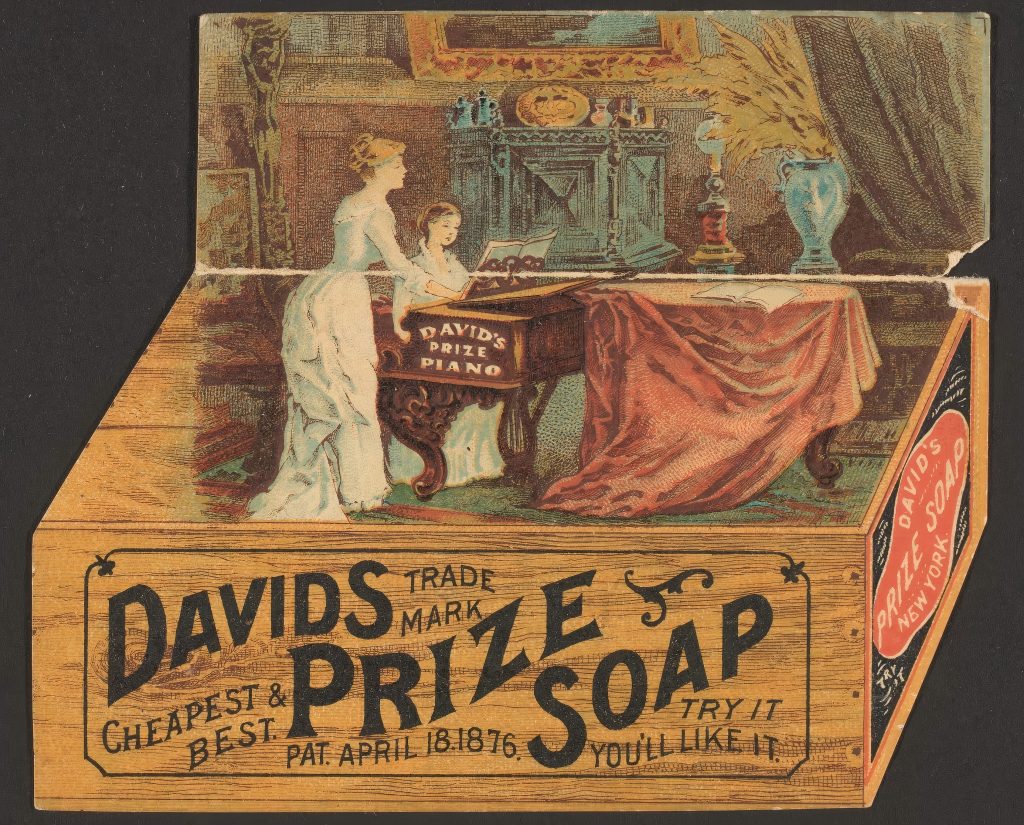
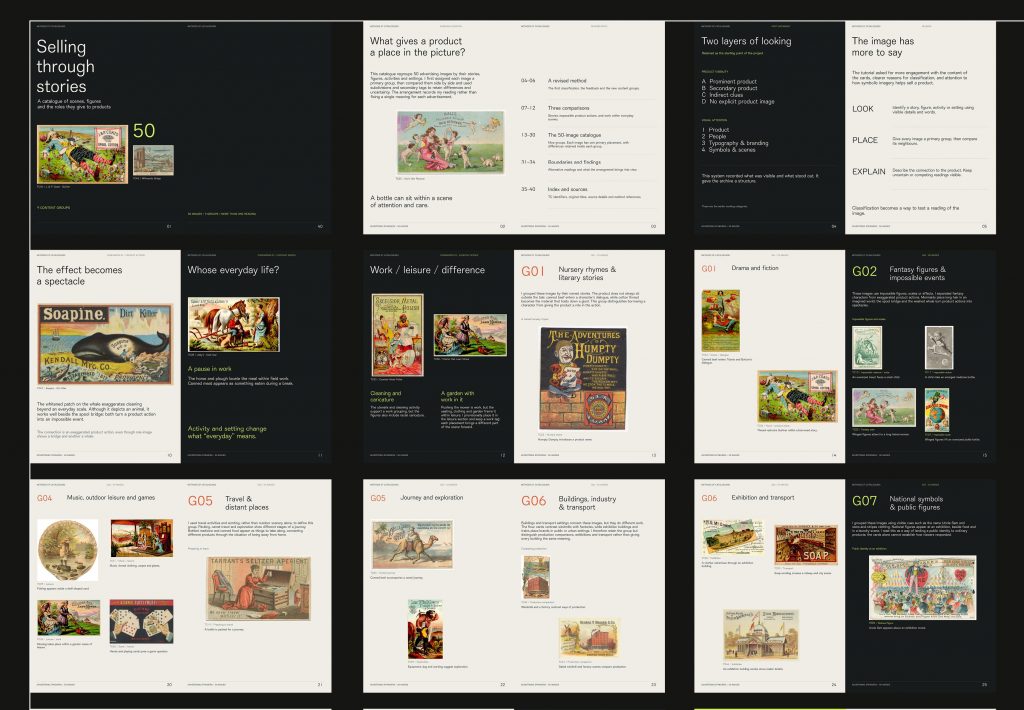
    In response to feedback, I regrouped 50 trade-card images by what they depict and brought the new groupings and comparisons together in a booklet.

    Written Response — Methods of Cataloguing

    What Belongs Together? An Inventory of Classification Criteria

    I examine the fourteen-part animal list that Foucault (1994) quotes from Borges in the preface to The Order of Things. So I regroup its entries according to the information they provide, and retain the original letter labels and paraphrase the entries below.

    1. Relations with people — a, c, g

    Animals owned by the emperor; tame animals; lost or homeless dogs.

    These entries describe animals through their relationships with people. One refers to ownership, another to behaviour towards people, and the third to being lost or without a home. I use these relationships as their shared basis for grouping.

    2. Bodily condition and behaviour — b, d, i, m

    Preserved bodies; piglets still feeding on milk; agitated animals; animals that recently broke a pitcher.

    These entries describe physical conditions, stages of life and actions. Because they include both lasting conditions and brief actions, I use a broad heading to bring them together for comparison.

    3. Imagined creatures — e, f

    Sirens; mythical animals.

    I group these together because both refer to imagined creatures. Sirens are an example of mythical animals, so the two entries overlap.

    4. Images and viewing distance — k, n

    Animals depicted with a fine brush; animals appearing fly-like from far away.

    These entries describe how animals appear to someone. I put them together to compare two conditions of seeing: how an image is drawn and how far away the viewer stands.

    5. Counting and listing — h, j, l

    Animals already covered by the classification; quantities beyond counting; et cetera.

    These entries concern what the list includes, how many animals there are, and what it leaves unnamed. The first can include all the other entries. The second gives no usable number. The third, “et cetera”, means there are other cases, but does not name them. I group these entries by what they say about the list’s contents and limits.

    The original list puts them one after another, with a letter beside each. But some describe who owns an animal, while others describe its condition or how it appears. I group entries that describe similar things together, so readers can see what they have in common and where they differ.

    References

    Foucault, M. (1994) ‘Preface’, The order of things: An archaeology of the human sciences. New York: Vintage Books. Available at: https://foucault.info/documents/foucault.orderOfThings.en/ (Accessed: 16 November 2026).
  • Methods of Iterating — From Image Settings to Thermal Paper

    Project Development

    Week 1 ↗

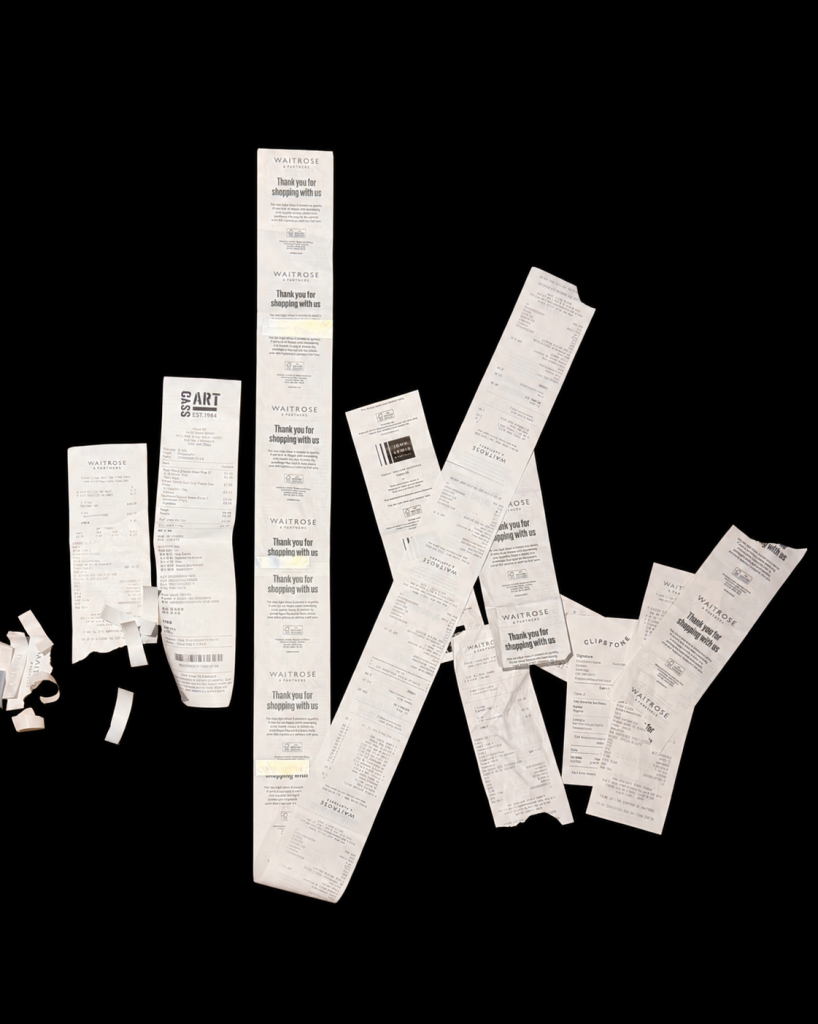
    Remaking Hanft’s receipt animation and testing thermal prints.

    Week 2 ↗

    Testing image treatments and assembling the butterfly animation.

    Week 3 ↗

    Varying treatments between frames and collaging thermal papers.

    Written Response — Methods of Iterating

    From Image Settings to Thermal Paper

    I began by remaking Adrian Hanft’s Moth in Flight on Receipts with a miniature thermal printer (Hanft, n.d.), extracting twenty frames from a butterfly video and lightening the background while keeping some background texture. By the 16 October tutorial, I had printed tests but had not assembled the animation. Screen detail did not reliably survive printing. I wanted to understand what made the image readable after this transfer.

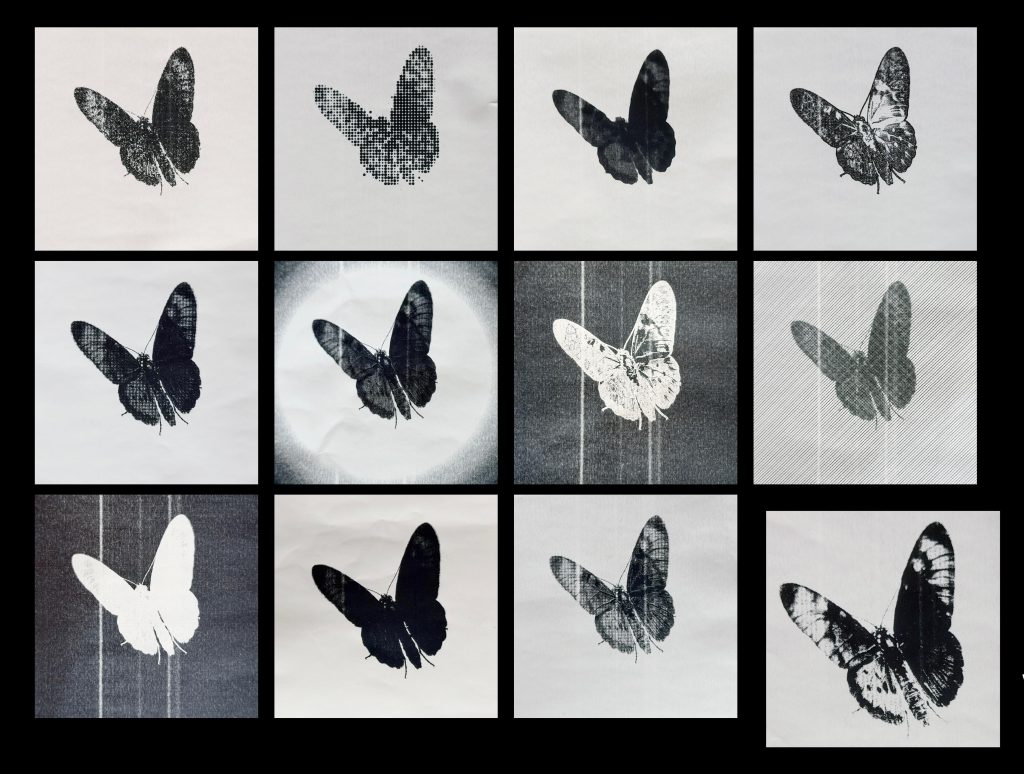
    For the 23 October tutorial, I dropped the background texture and used a butterfly video with a white background, extracting seven frames per second. My thermal printer prints only in black and white and cannot reproduce continuous grey tones, so I used dithering to simulate them through different densities of black dots. More dots make an area look darker; fewer dots make it look lighter. I then selected one of these dithered frames to test different print styles. I tested more than twenty Photoshop parameter combinations on this frame and presented twelve printed samples, including tonal adjustments, inversion and outline effects. I selected the setting that worked best, applied it across the sequence, photographed each printed frame and assembled the animation.

    Feedback on 23 October encouraged me to try a different image treatment on every frame. I tested this in a new twenty-frame spider animation. Queneau’s retellings of the same incident in Exercises in Style (2013, pp. 3–5) help me understand this shift from choosing one style to exploring variation. Yet in practice, applying a different treatment to each frame meant that both the subject’s position and its graphic style changed at once. I could not clearly distinguish how each contributed to the visual effect.

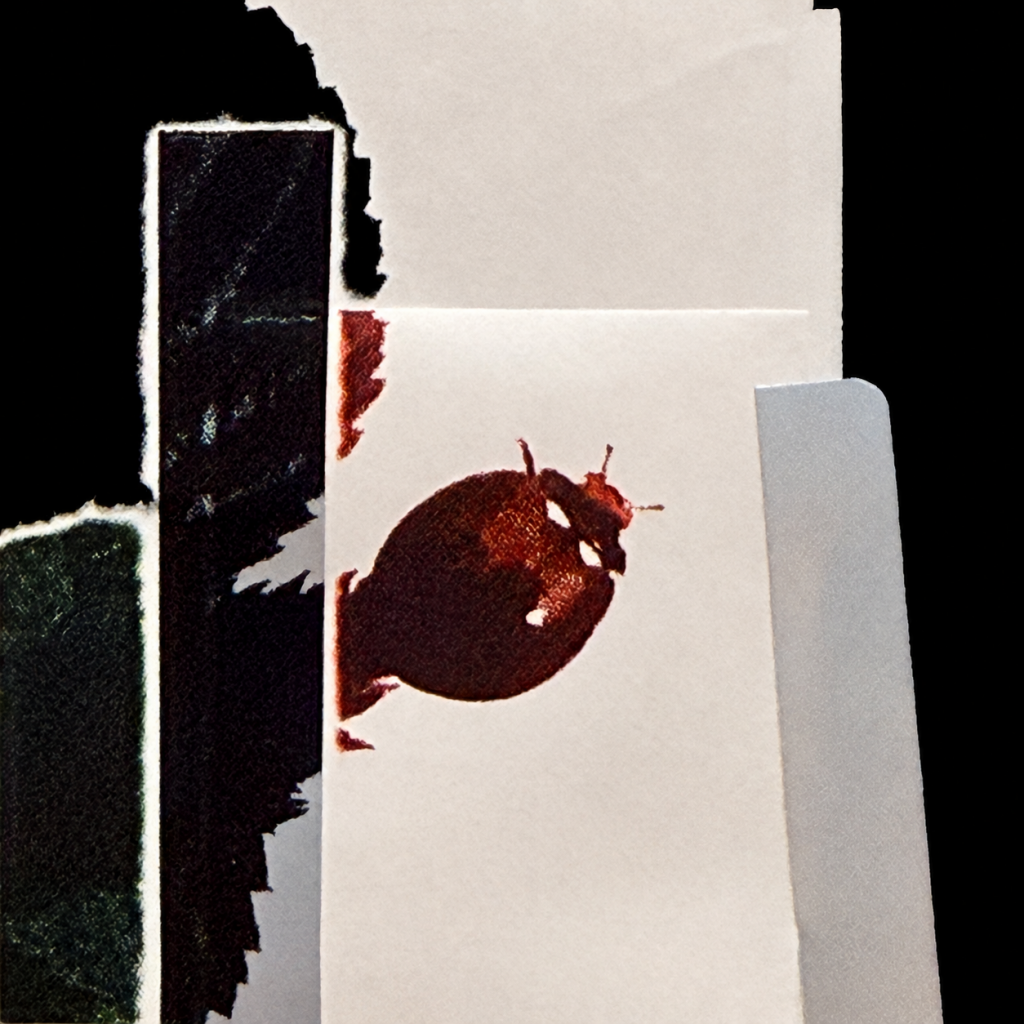
    When I ran out of receipts, I switched to thermal paper rolls for a twenty-eight-frame ladybird sequence. I used a roll that printed green as the base and pasted squares and strips of other thermal papers onto it. All looked white before printing; afterwards, the added pieces produced red, black and silver marks. Bolt describes “a knowing that arises through handling materials in practice” (2010, p. 29). She also argues that “materials are not just passive objects” (2010, pp. 29–30). I could choose the shapes and positions of the paper pieces, but their response to printing determined the colours. This made the paper an active part of how I constructed the image. I initially only needed a replacement for receipts, but printing revealed another way to alter the image. Choosing papers and placing cut shapes became part of image-making, alongside adjusting pixels in Photoshop. What began as a practical substitution expanded my tests from screen settings to the paper surface itself.

    References

    Bolt, B. (2010) ‘The magic is in handling’, in Barrett, E. and Bolt, B. (eds.) Practice as Research: Approaches to Creative Arts Enquiry. London: I.B. Tauris, pp. 27–34.

    Hanft, A. (n.d.) Receipt animations. Available at: https://adrian3.com/art/receipt-animation.html (Accessed: 3 November 2026).

    Queneau, R. (2013) Exercises in Style. Translated by Barbara Wright. Richmond: Alma Classics.

    Written Response — Drafts 1–3

    The full text of Draft 3 appears above; the PDF includes a photograph of its thermal-printed form.

  • Making the Temporary Readable: Behavioural Notation at a Canal Archway

    Written Response — Methods of Investigating

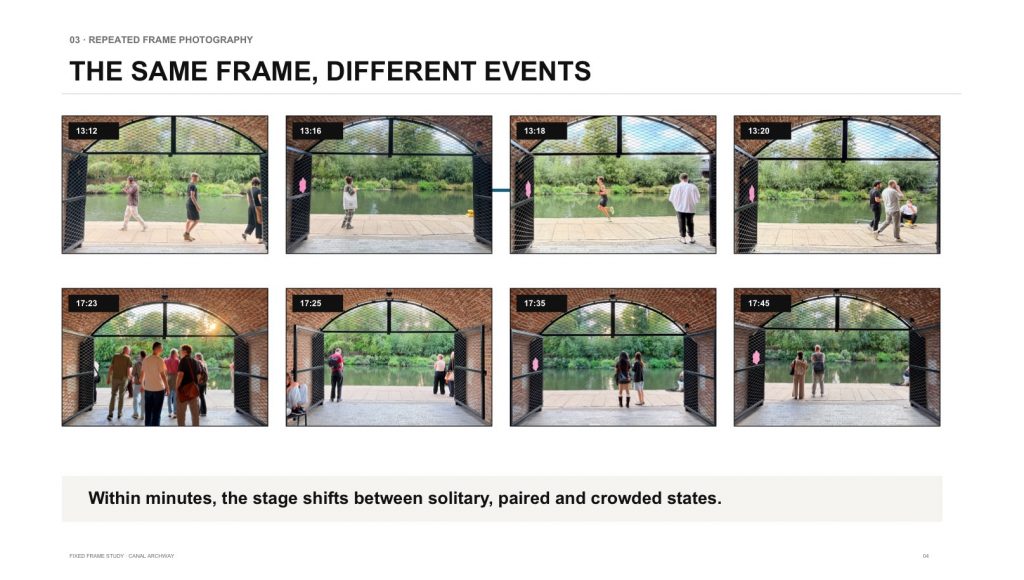
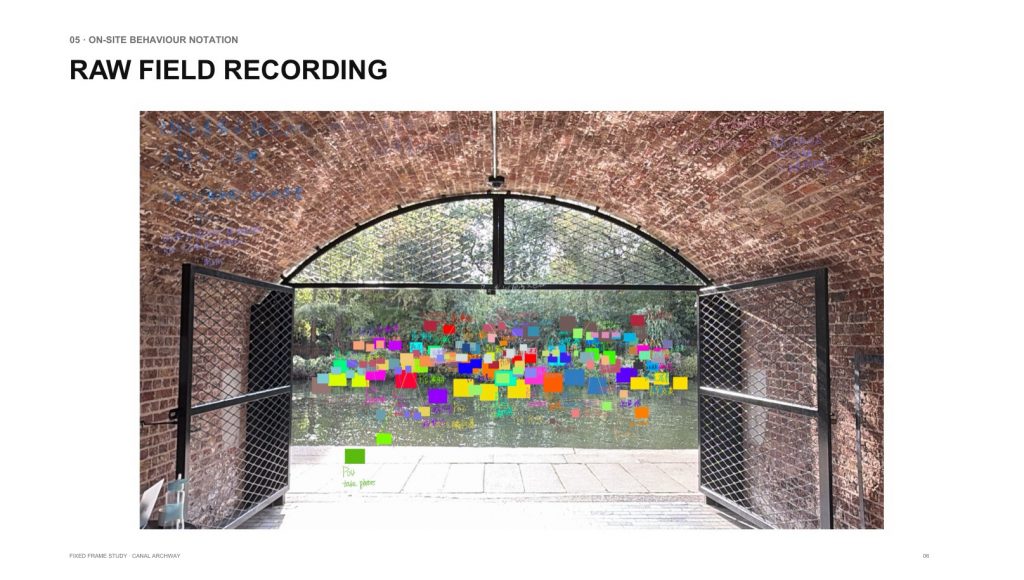
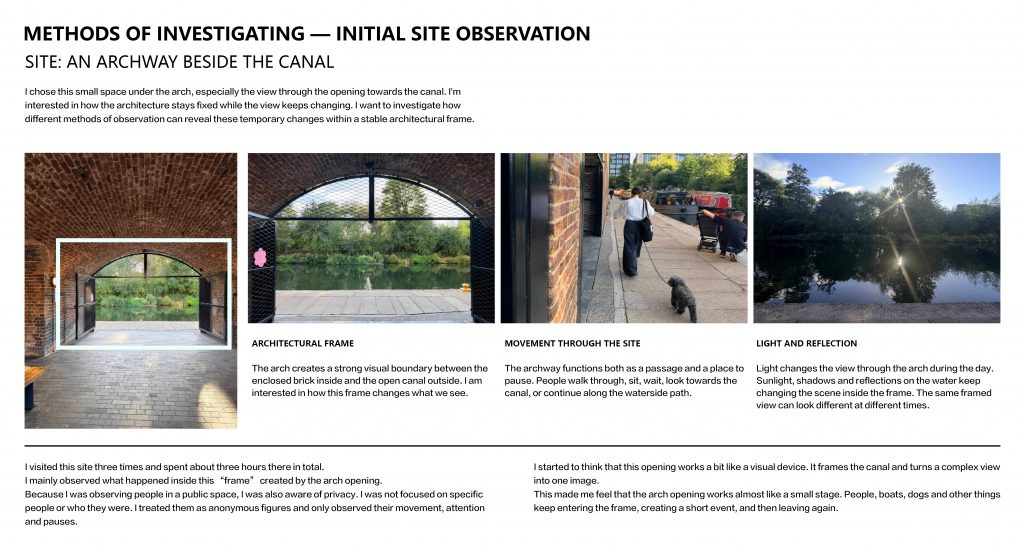
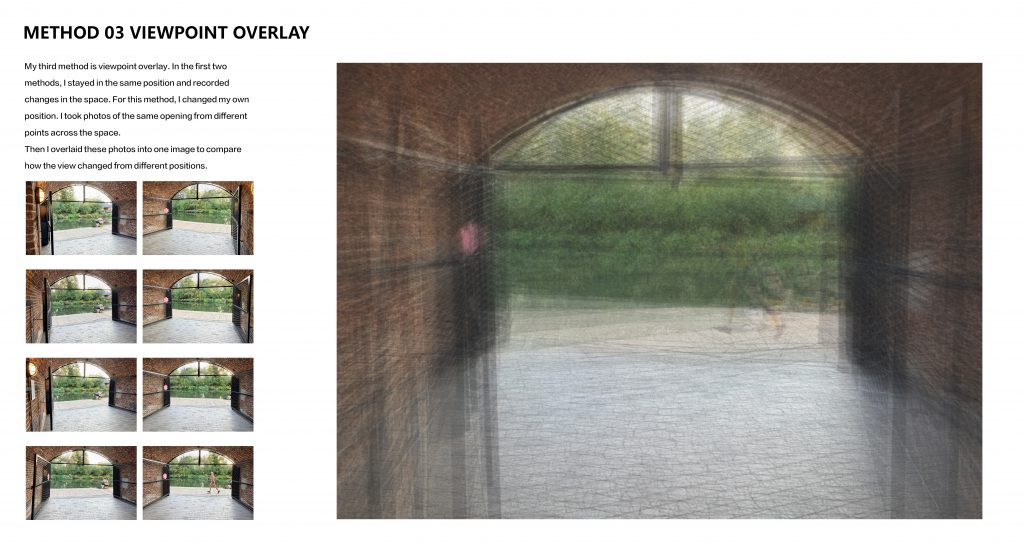
    I investigated a small space beneath an archway in King’s Cross and its view towards the canal. I started to see this fixed opening as a small stage. People and objects kept entering the frame, creating brief events, and then leaving again. During the 25 September tutorial, I compared fixed-frame photography, behavioural coding and viewpoint overlays. I developed behavioural notation because it shifted my focus from changing images towards how people moved, paused and used the space. My main question was: how could notation make these temporary uses of a fixed space readable?

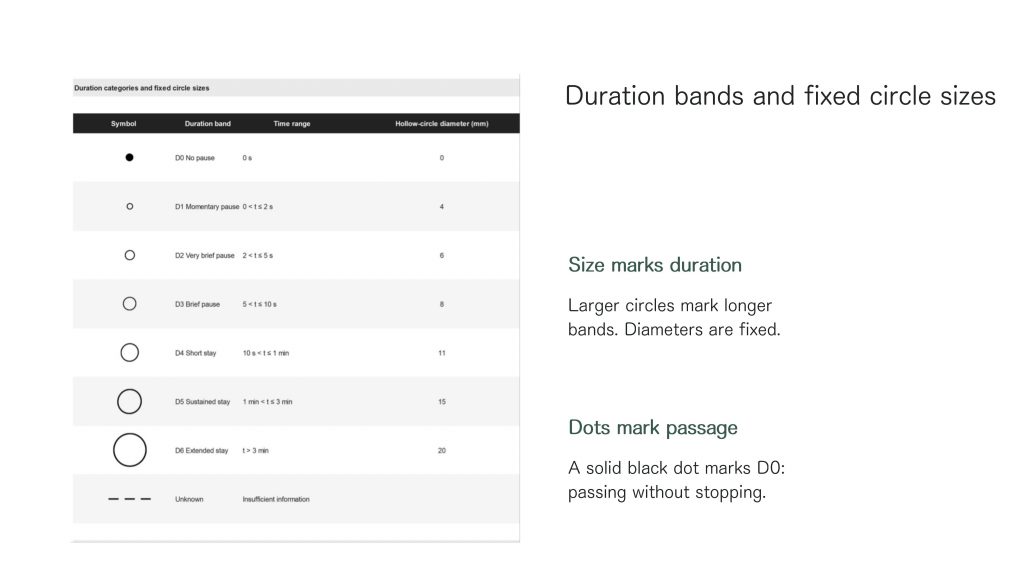
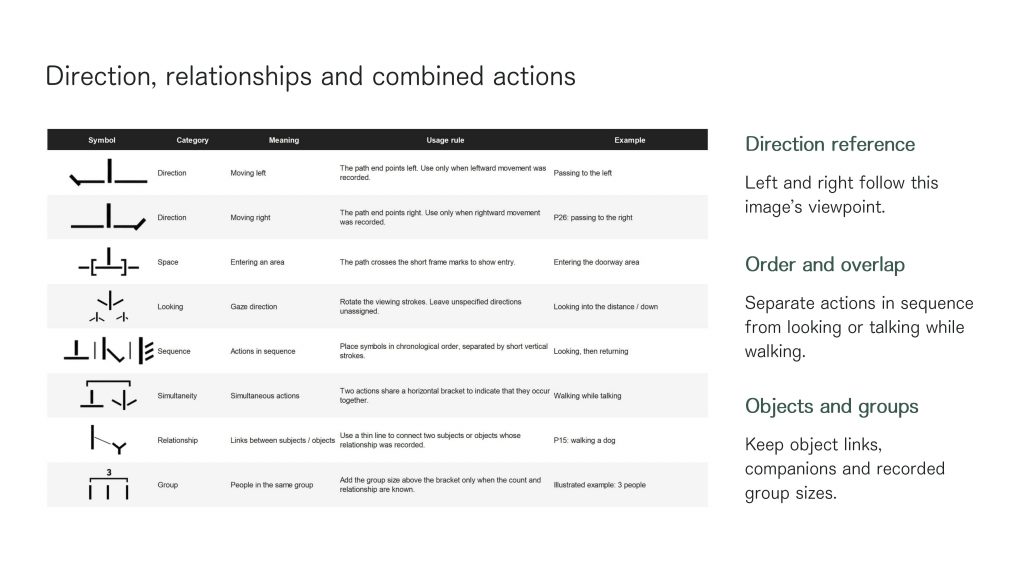
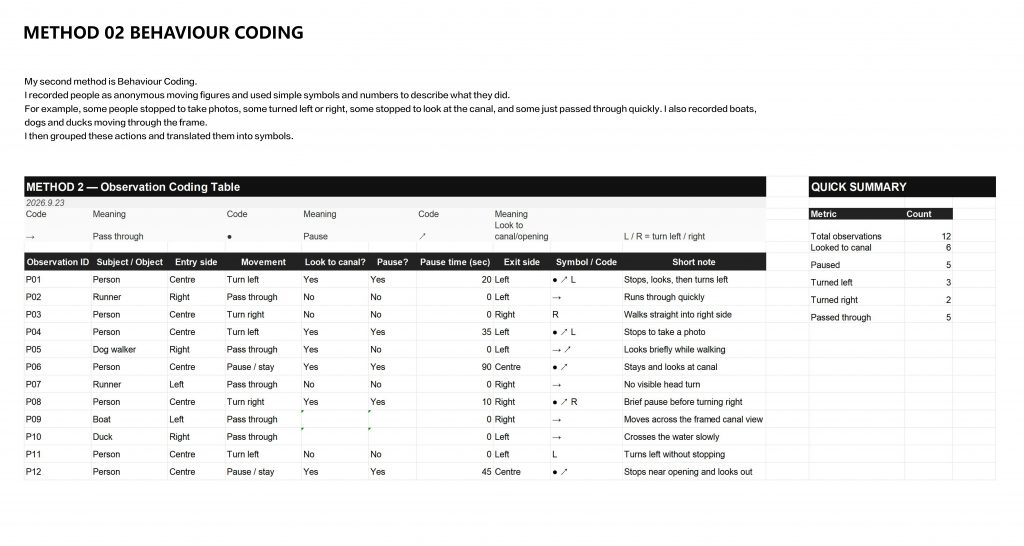
    Georges Perec’s ‘The Street’ connects to this investigation through process. His exercises ask readers to attend patiently to ordinary details, record the circumstances of observation and avoid ignoring familiar activity (Perec, 1999, pp. 50-53). Reading his work helps me understand repeated visits as a way of sharpening attention. By recording direction, duration, and specific actions, I distinguished the different events that initially just looked like “someone passing by”. I realised that notation is not just an objective record: it challenges my habits of seeing.

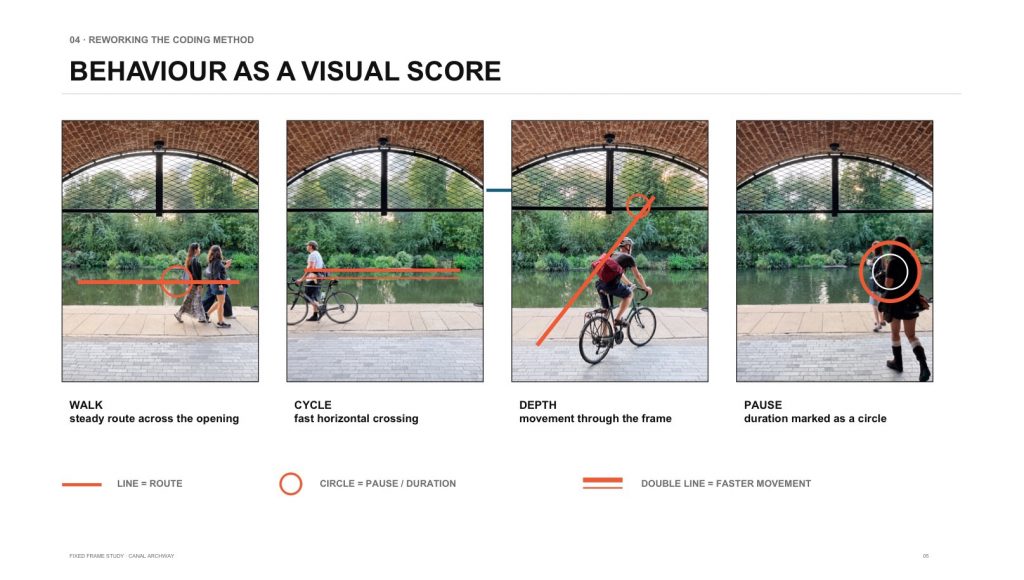
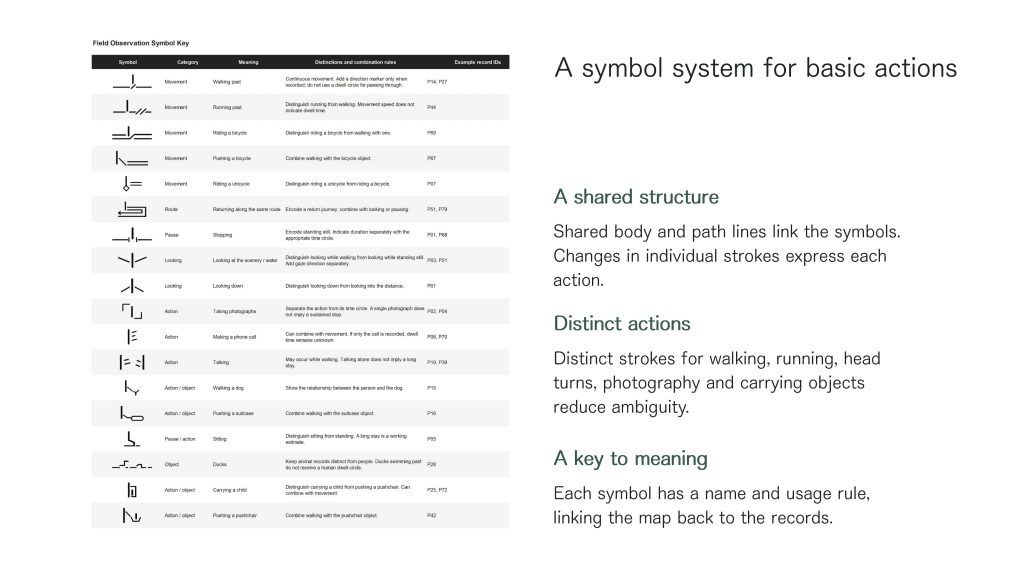
    My method started with quick written notes on site, which I later turned into organised visual records. Scottish Country Dancing diagrams provided a practical reference for both my symbols and the table pairing each symbol with its meaning (‘Course in Scottish Country Dancing diagrams‘, 2012). Their compact signs helped me think about making movement readable. These diagrams support recall of established dances; my adaptation instead organises observations of unplanned everyday activity.

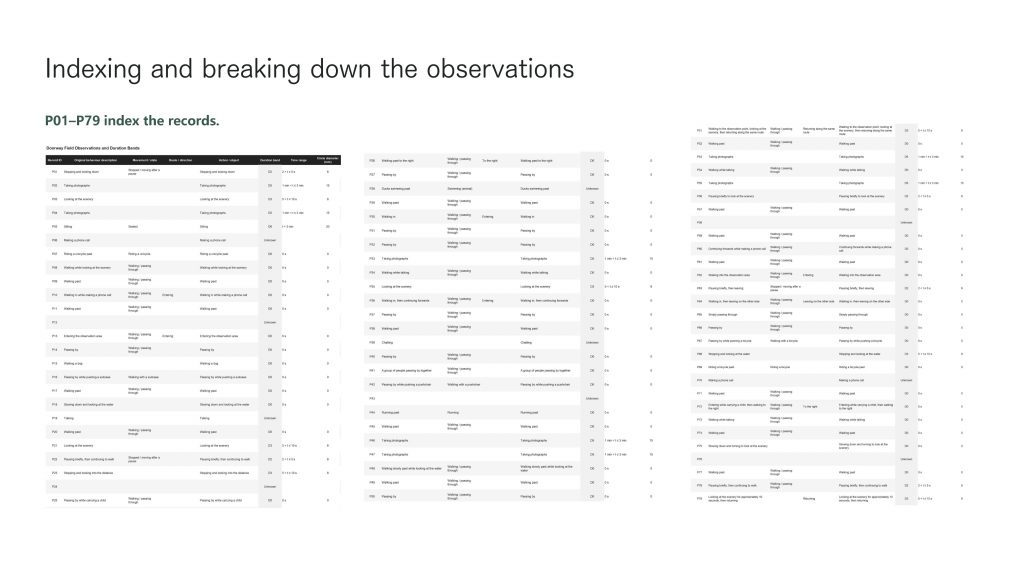
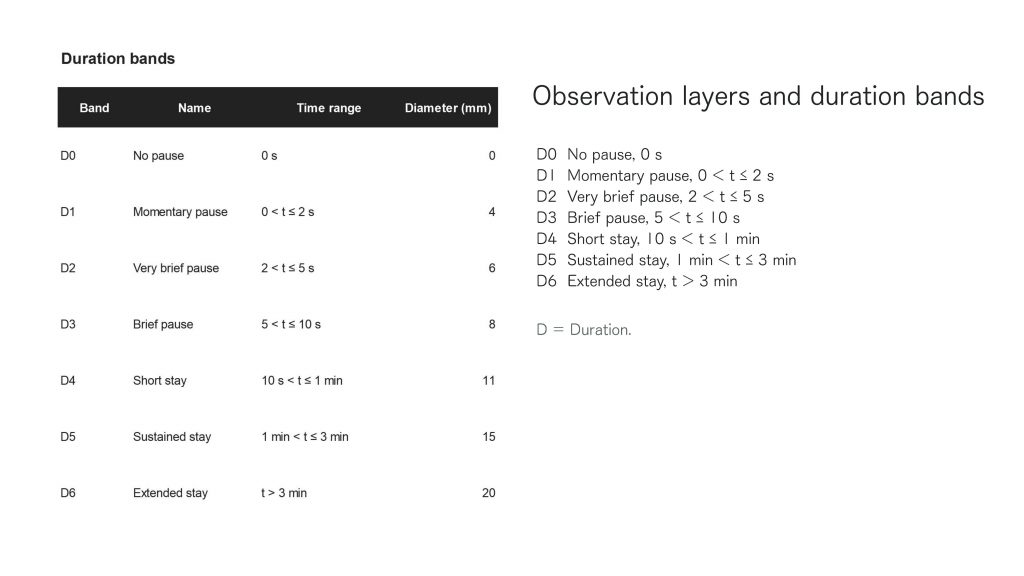
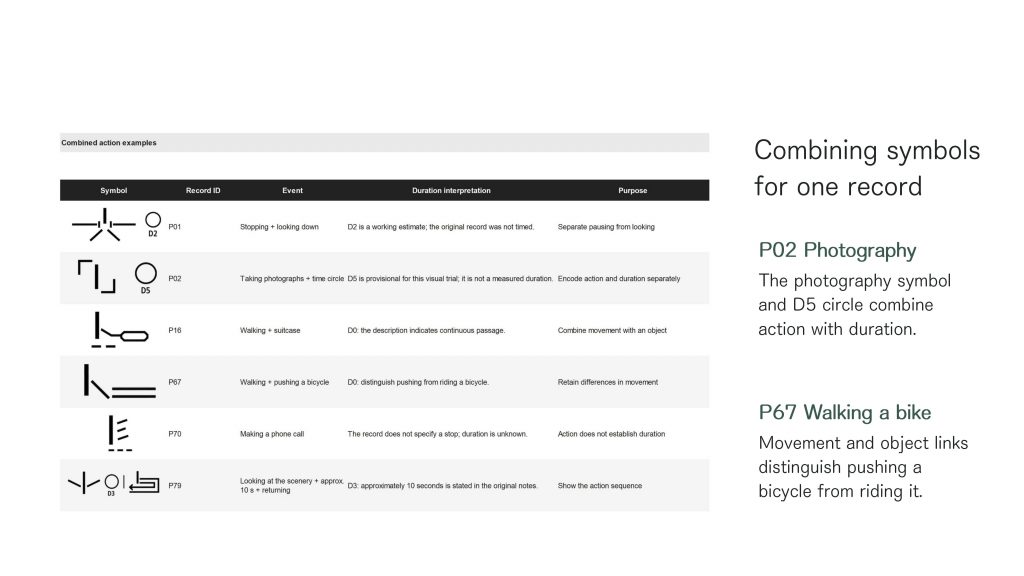
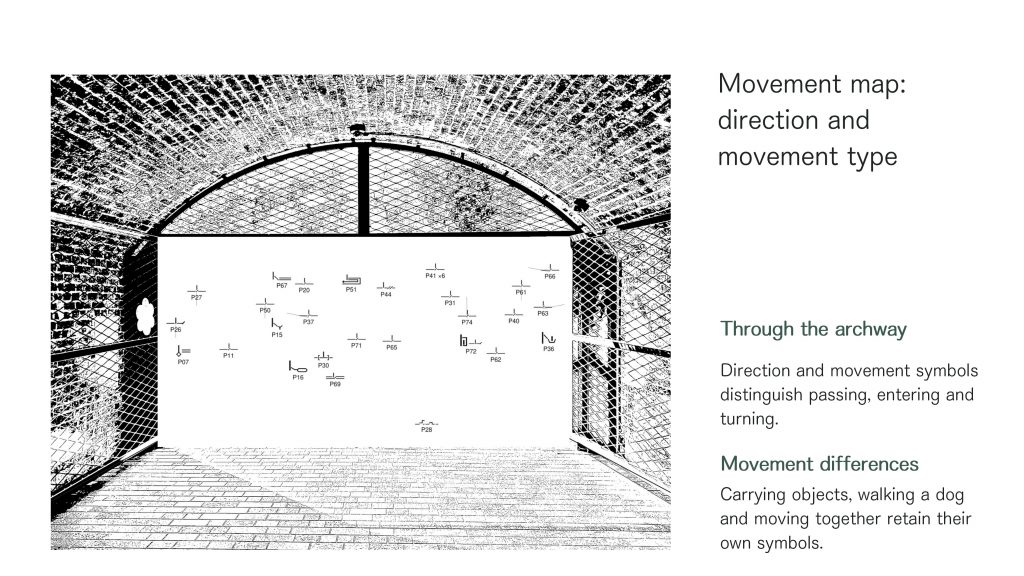
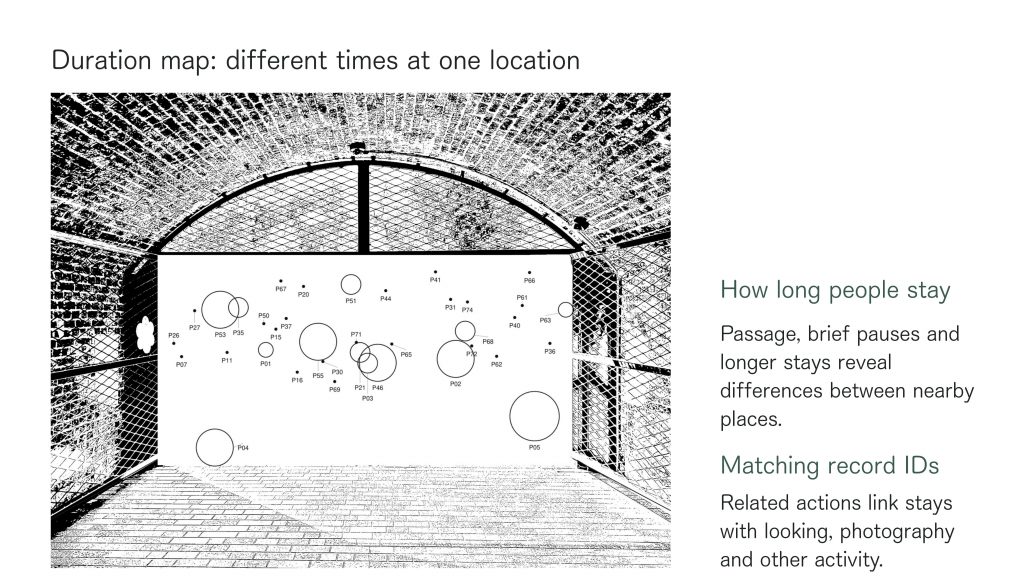
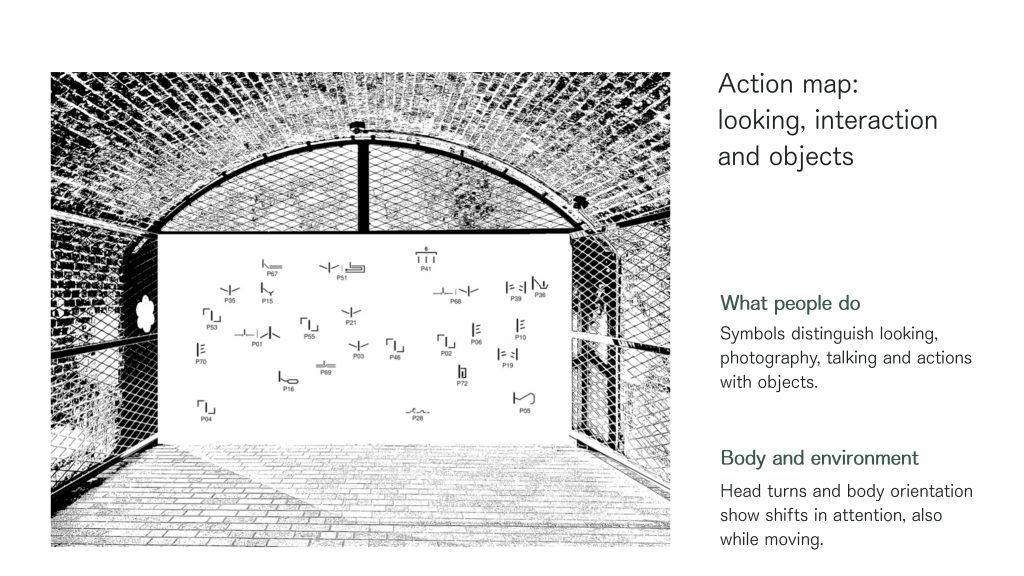
    By 2 October, I had separated crowded field notes into three diagrams: movement, duration and specific actions. Information that overlapped in the notes could now be examined separately. For 9 October, I refined the symbols and diagrams and explored a higher viewpoint. Shared record numbers allowed the three diagrams to be read together.

    Johanna Drucker’s ‘Designing graphic interpretation’ connects through form. She describes how multiple views can complement one another when shared elements make their relationships explicit (Drucker, 2014, p. 188). Applying her idea about digital environments to my static diagrams helped me understand the significance of layering: each view highlights a different question from the same set of observations. Separating information alone does not explain its relationships; shared record numbers make the connections traceable. Together, these layers help me understand how people use the space, including what they do when they stop.

    The 9 October feedback extended this approach by asking how the symbols might support rapid recording during observation. My tutor suggested I continue exploring the hand-drawn style of Dear Data (Lupi and Posavec, n.d.). My next step is to develop this direction by sketching and testing if my symbols can keep up with the actual speed of the events.

    Perec helps me notice details I might otherwise overlook, while Drucker helps me organise these observations in linked diagrams. Together, they help me see how notation can make temporary uses of the space readable by linking what I notice on site with how I present it.


    References

    Course in Scottish Country Dancing diagrams (2012) [Online course slides], 25 October. Available at: https://www.rscds-bhs.org.uk/file/20121025oslo/Course.html/index.html (Accessed: 13 October 2026).

    Drucker, J. (2014) Graphesis: Visual forms of knowledge production. Cambridge, MA: Harvard University Press.

    Lupi, G. and Posavec, S. (n.d.) The project. Dear Data. Available at: https://www.dear-data.com/theproject (Accessed: 13 October 2026).

    Perec, G. (1999) Species of spaces and other pieces. Translated by J. Sturrock. Revised edn. London: Penguin Books.

  • 2 & 9 Oct — Developing a Behavioural Notation System

    Following my initial experiments, I focused on behavioural coding to investigate how people moved through and paused around the canal archway.

    For the 2 October tutorial, I translated my handwritten observations into an initial symbol system. As my fieldwork drawing was crowded and difficult to read, I organised the information into three separate diagrams: a Movement Map, a Duration Map and an Action Map. These recorded how people moved, how long they stayed and what they did.

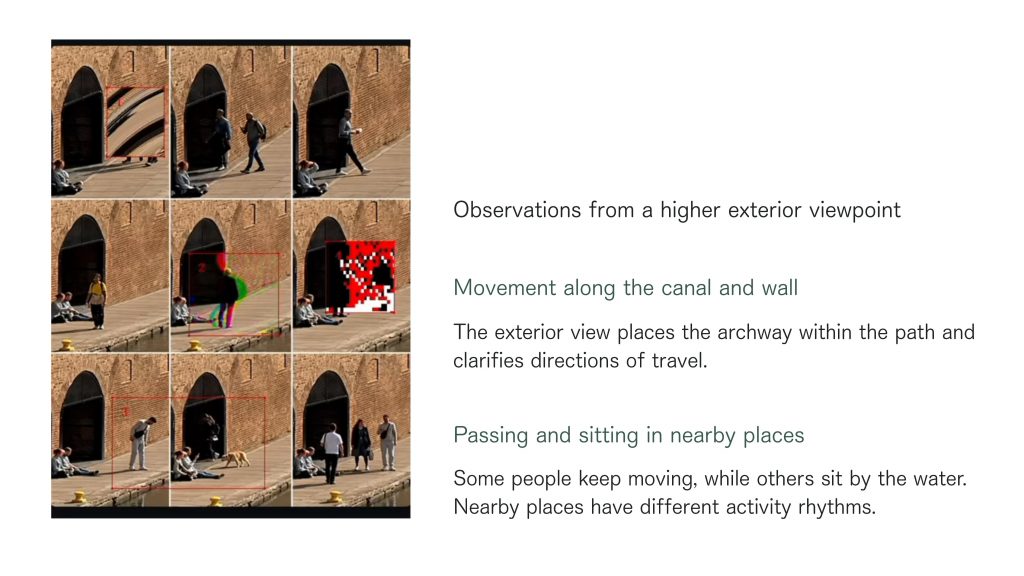
    For the 9 October tutorial, I refined the symbols and reorganised the diagrams to make the different layers easier to compare. I also explored the site from a higher viewpoint and carried out further visual experiments to better understand its spatial context.

    The images below document the work presented on 2 and 9 October. I have kept the first four slides from 2 October, followed by the revised maps and additional experiments from 9 October. For the Movement Map, Duration Map and Action Map, I have included only the revised versions to avoid repetition.


    2 October — Initial notation system


    9 October — Revised notation system


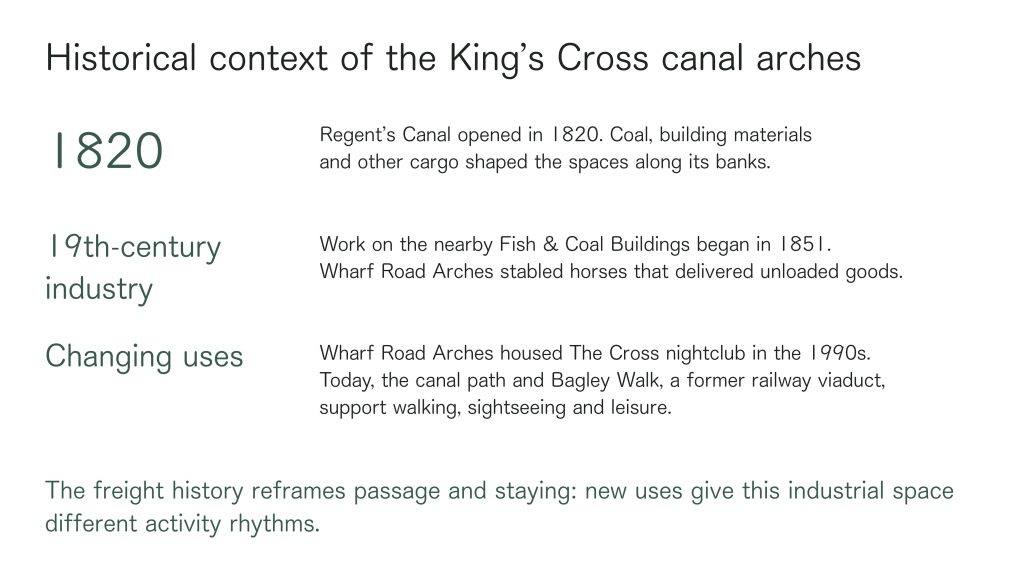
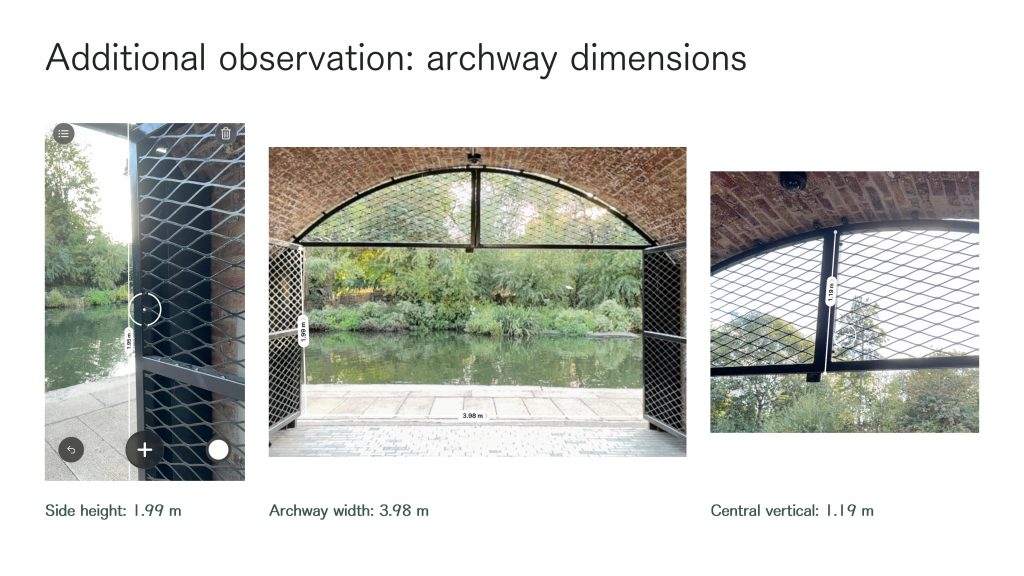
    Site Context — History and Measurements

  • 25 Sep — Testing Three Research Methods

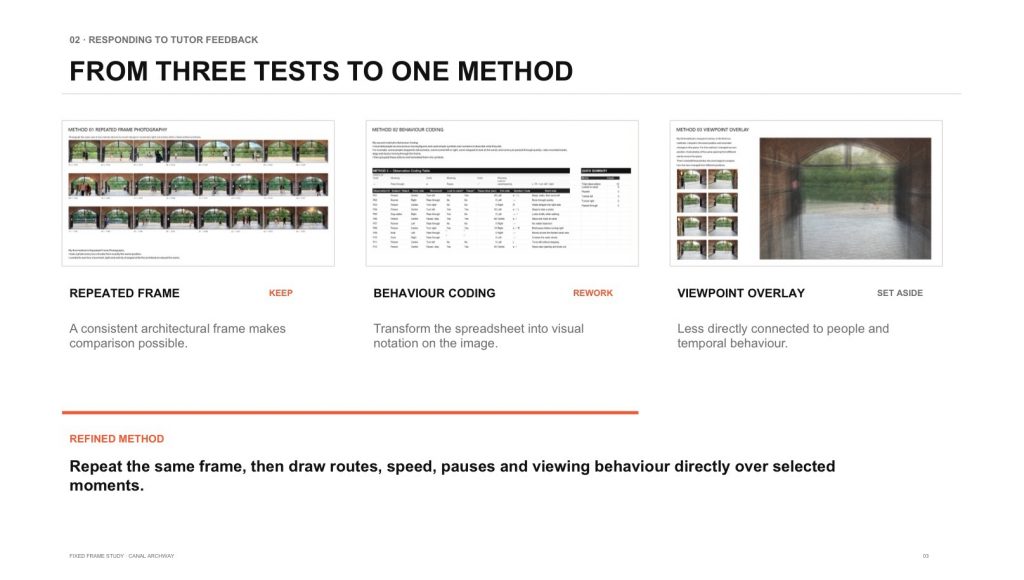
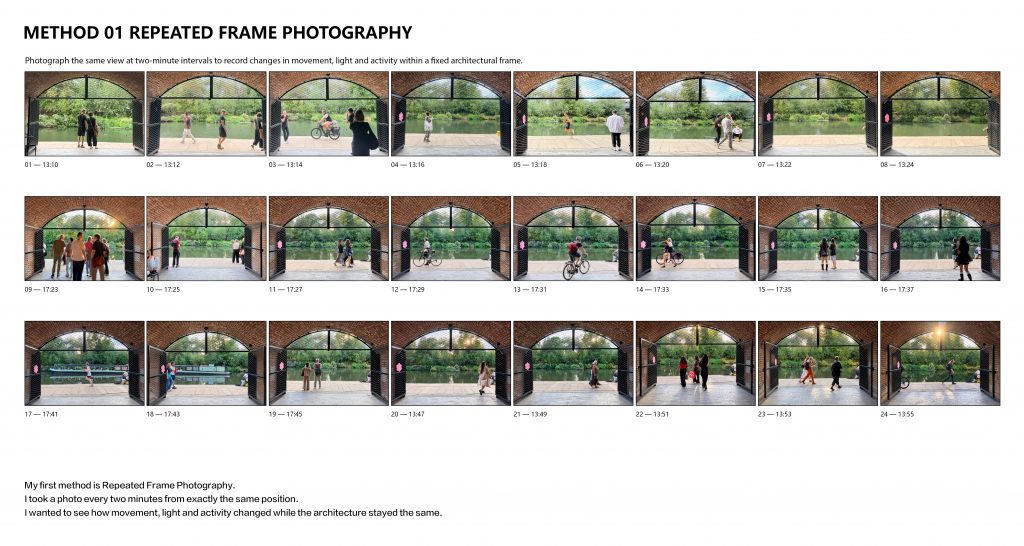
    Fixed-frame photography recorded changes within the same composition.

    Behaviour coding focused on people’s movements, looking and pauses, translating observations into symbols.

    Viewpoint overlay involved photographing the same opening from different positions and layering the images to compare how the view changed.

  • Hello world!

    Welcome to myblog.arts. This is your first post. Edit or delete it, then start blogging!