Written Response — Methods of Investigating
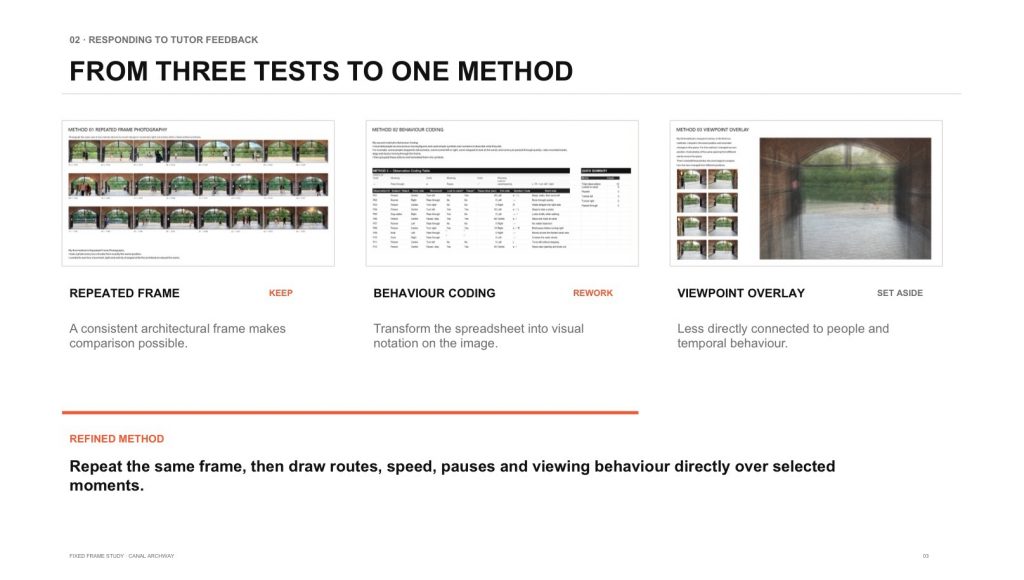
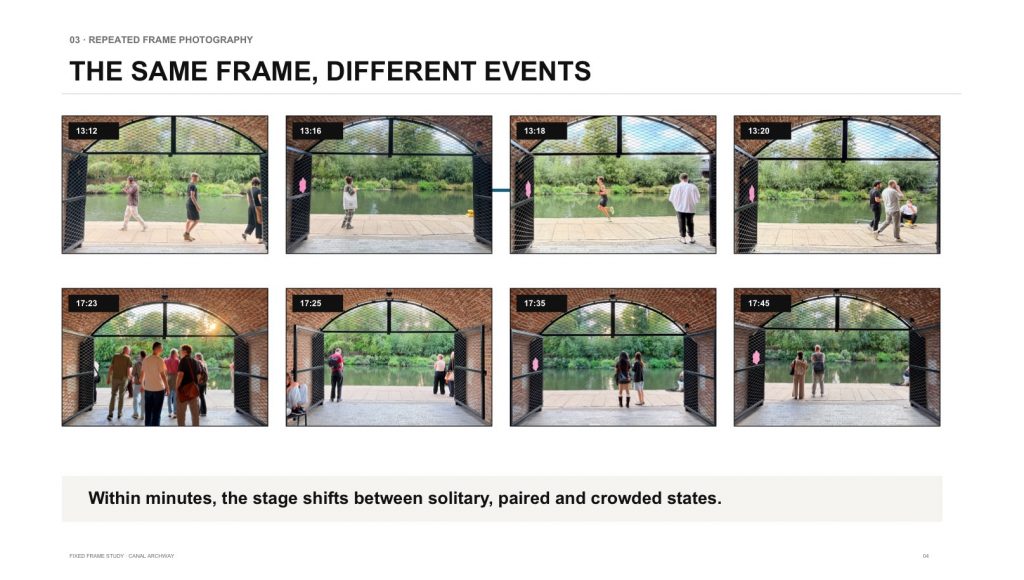
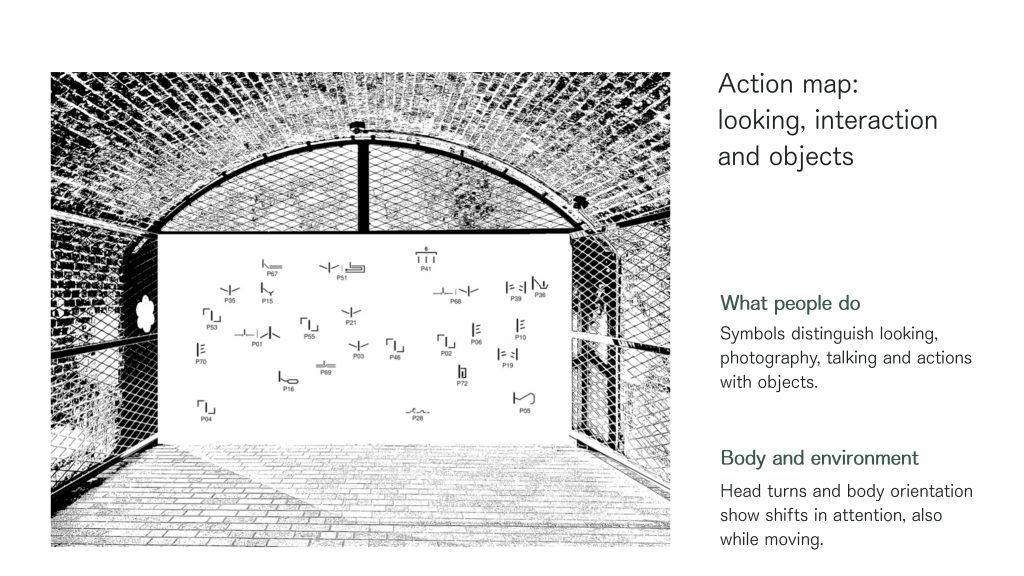
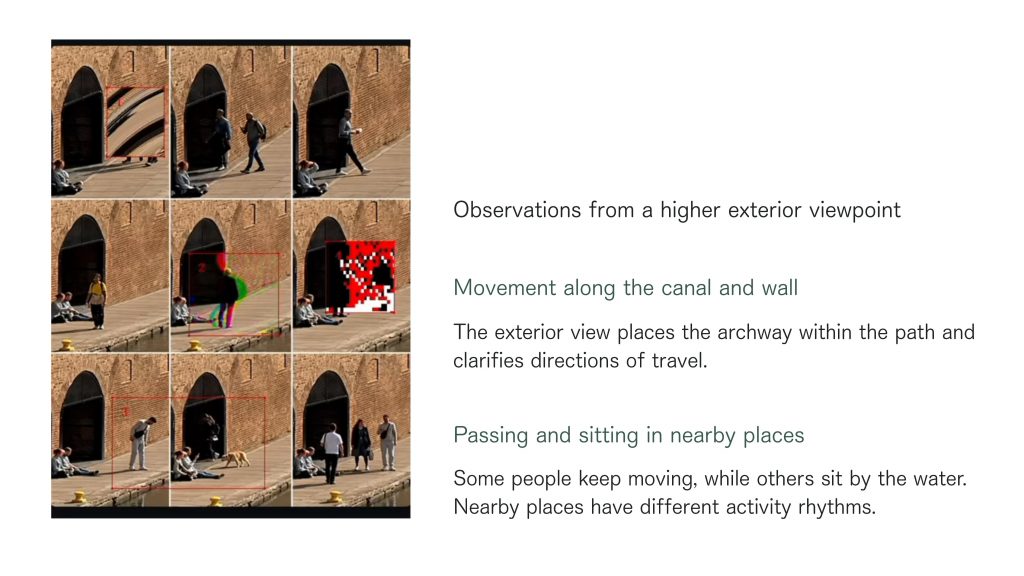
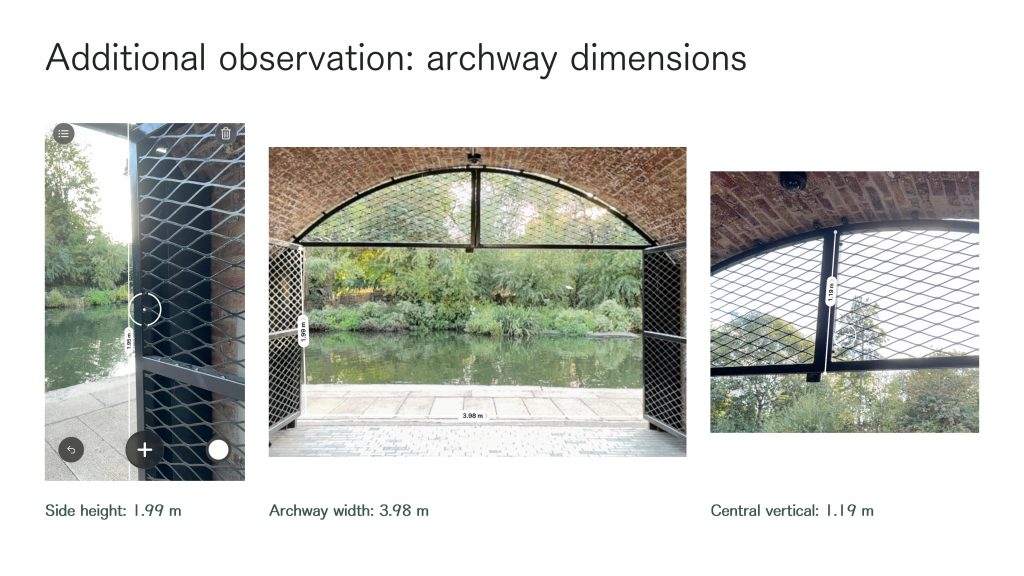
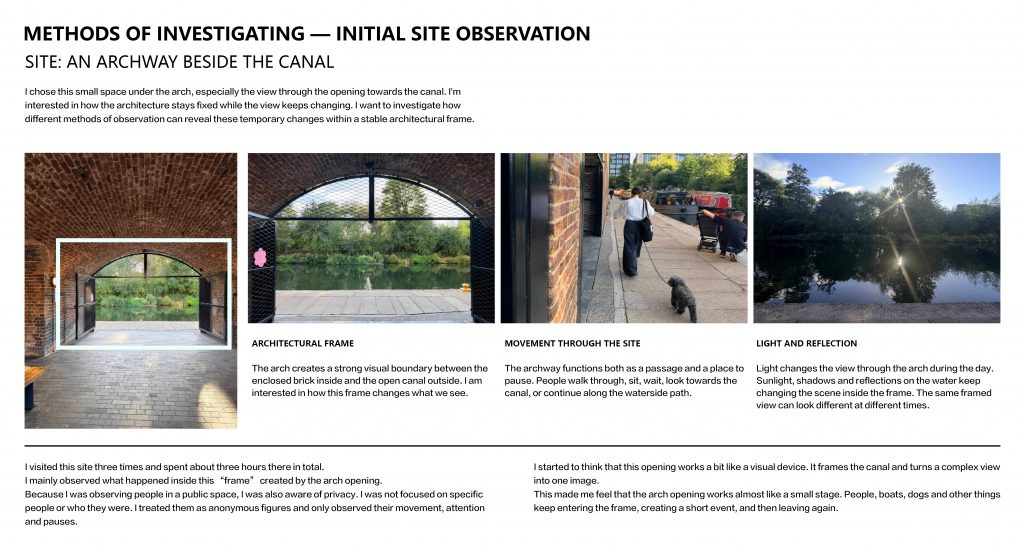
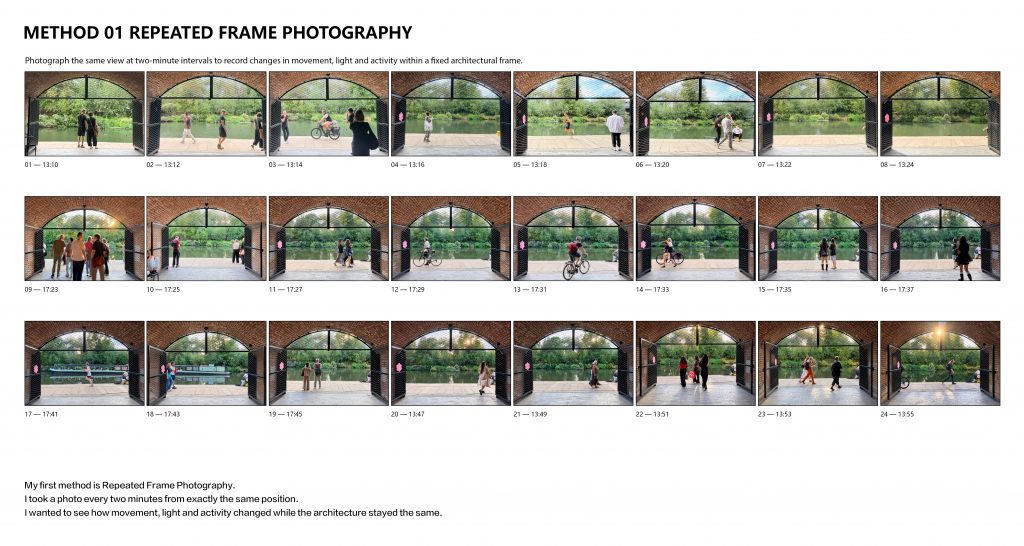
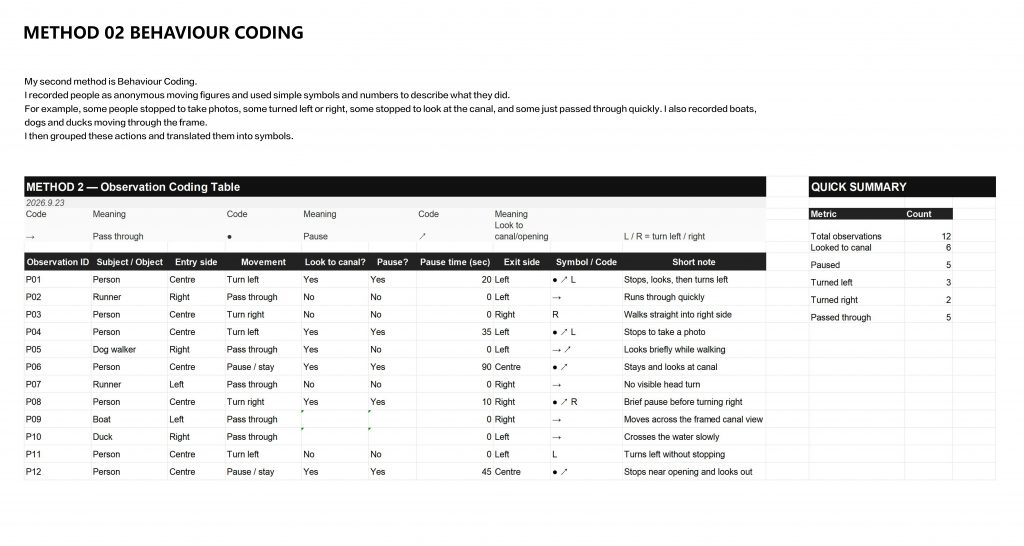
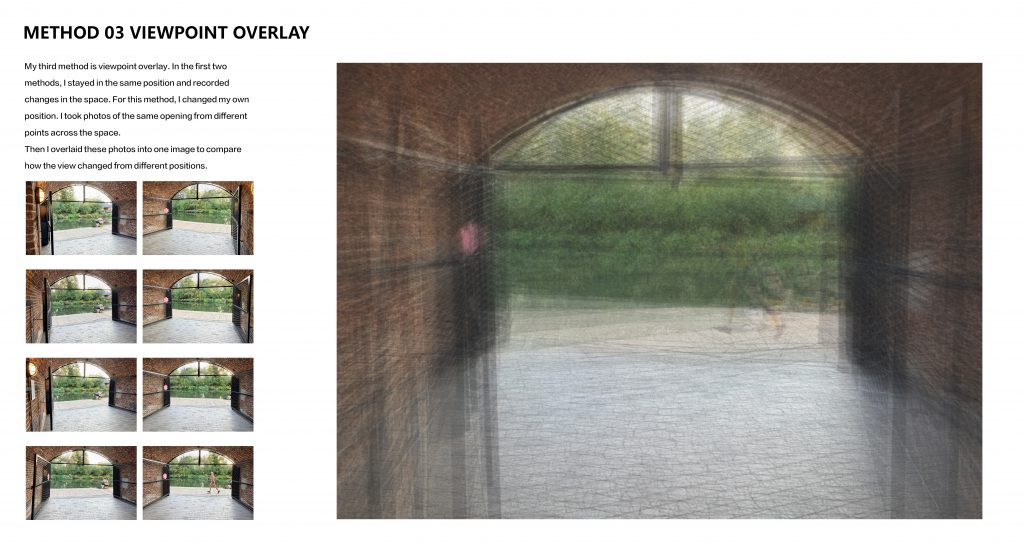
I investigated a small space beneath an archway in King’s Cross and its view towards the canal. I started to see this fixed opening as a small stage. People and objects kept entering the frame, creating brief events, and then leaving again. During the 25 September tutorial, I compared fixed-frame photography, behavioural coding and viewpoint overlays. I developed behavioural notation because it shifted my focus from changing images towards how people moved, paused and used the space. My main question was: how could notation make these temporary uses of a fixed space readable?
Georges Perec’s ‘The Street’ connects to this investigation through process. His exercises ask readers to attend patiently to ordinary details, record the circumstances of observation and avoid ignoring familiar activity (Perec, 1999, pp. 50-53). Reading his work helps me understand repeated visits as a way of sharpening attention. By recording direction, duration, and specific actions, I distinguished the different events that initially just looked like “someone passing by”. I realised that notation is not just an objective record: it challenges my habits of seeing.
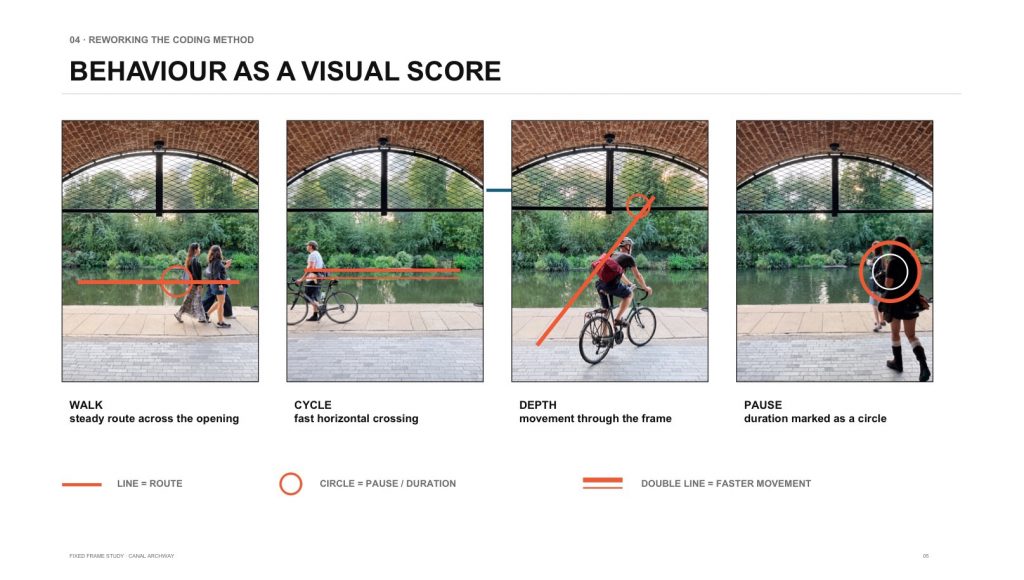
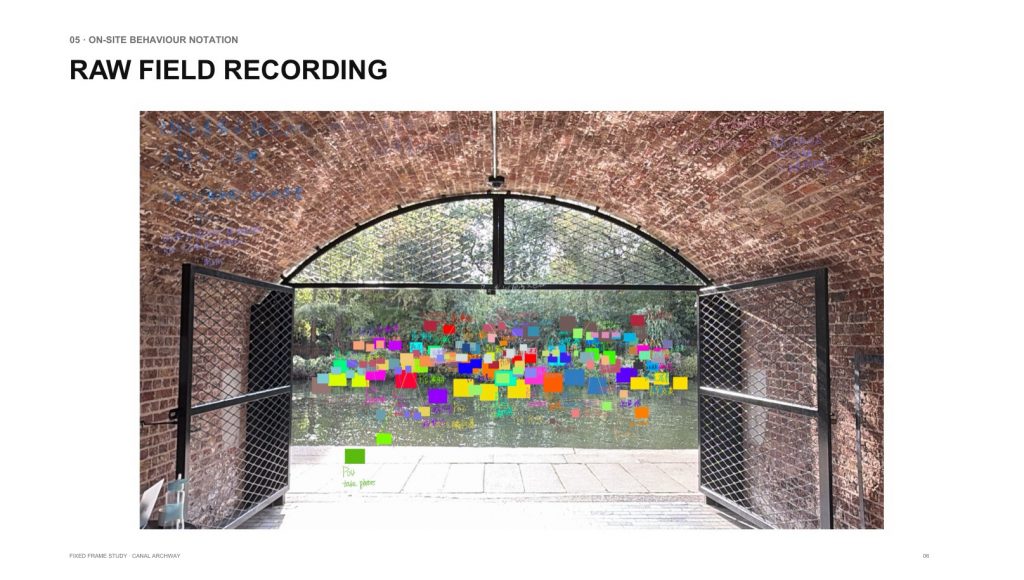
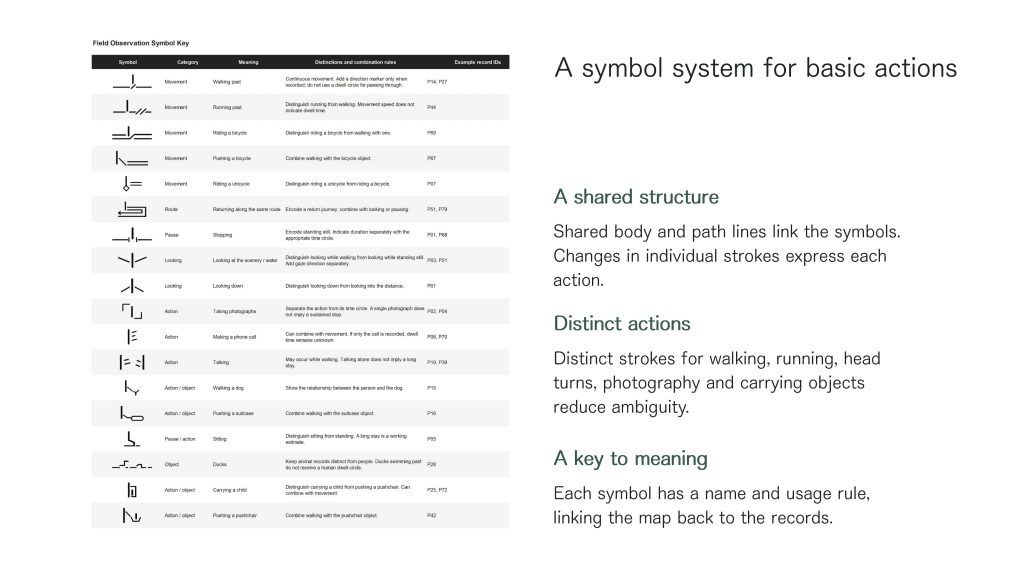
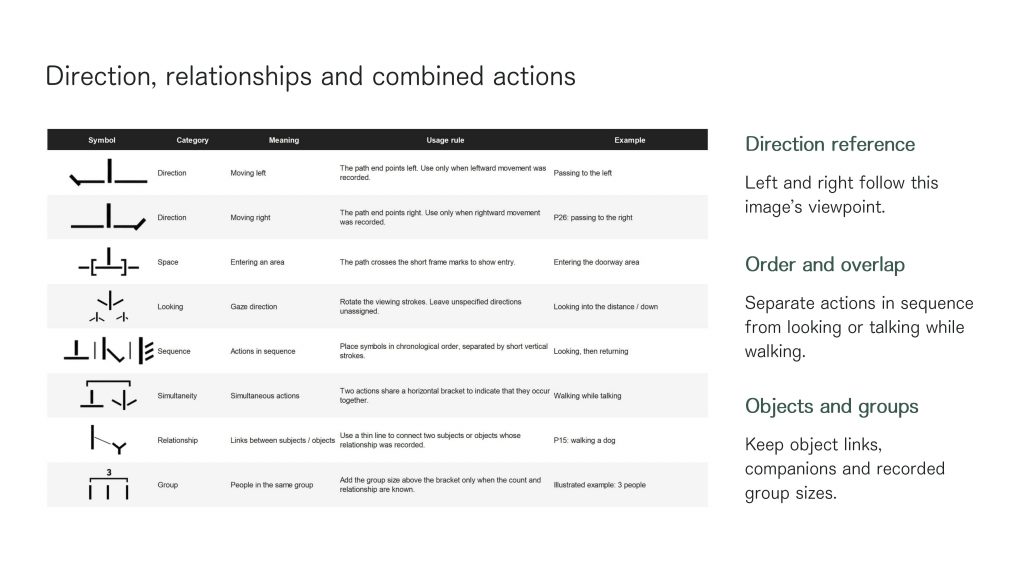
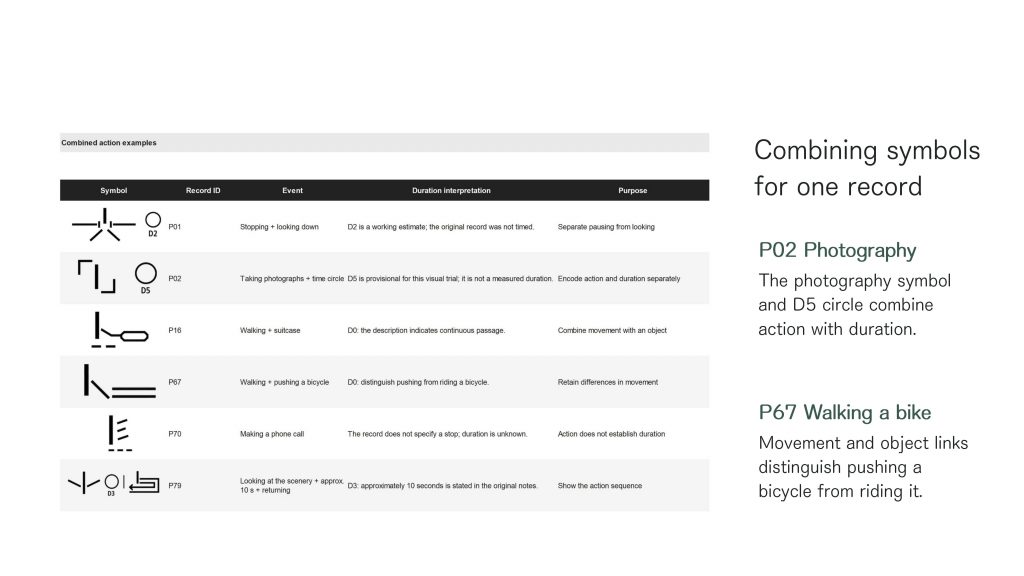
My method started with quick written notes on site, which I later turned into organised visual records. Scottish Country Dancing diagrams provided a practical reference for both my symbols and the table pairing each symbol with its meaning (‘Course in Scottish Country Dancing diagrams‘, 2012). Their compact signs helped me think about making movement readable. These diagrams support recall of established dances; my adaptation instead organises observations of unplanned everyday activity.
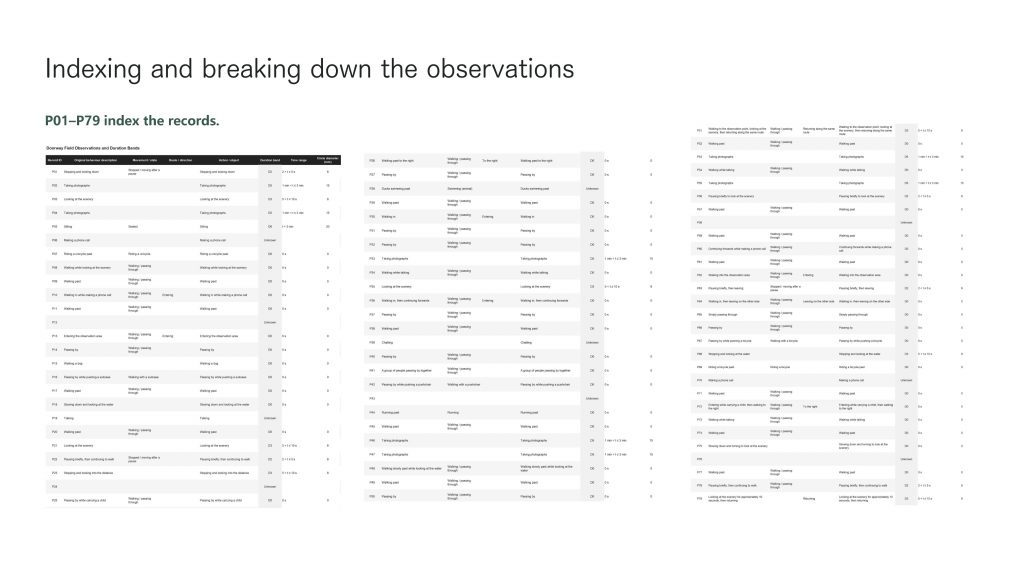
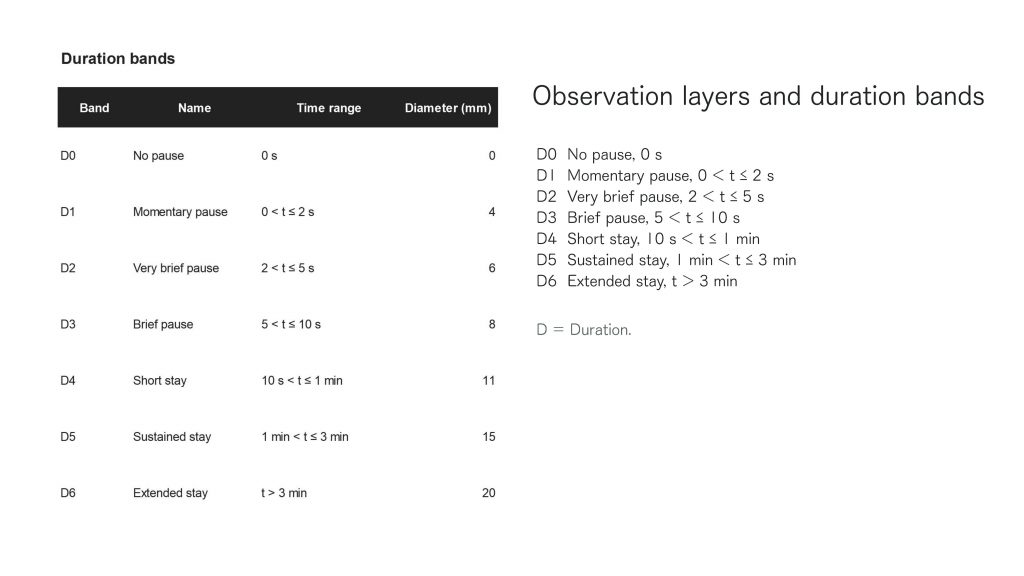
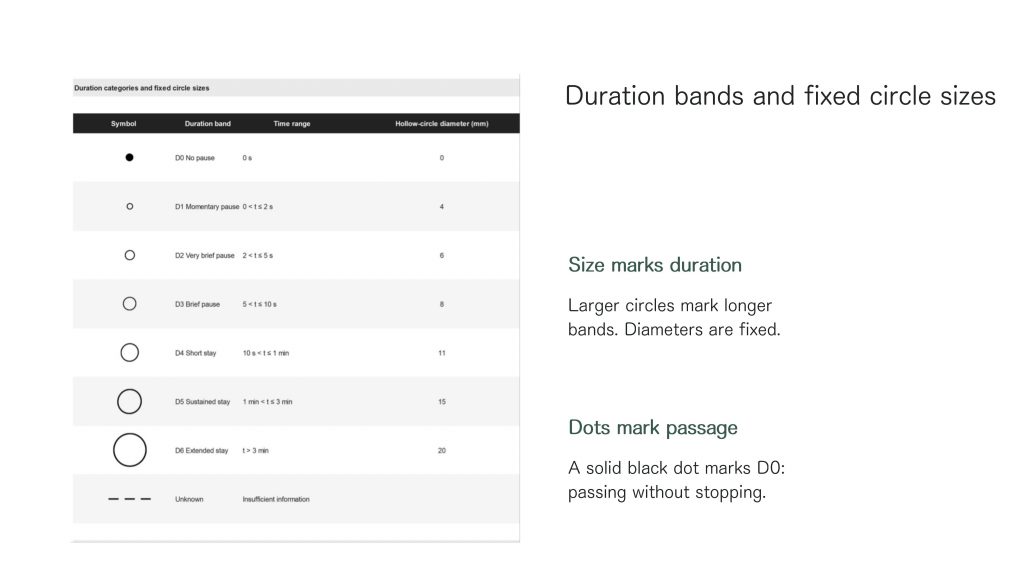
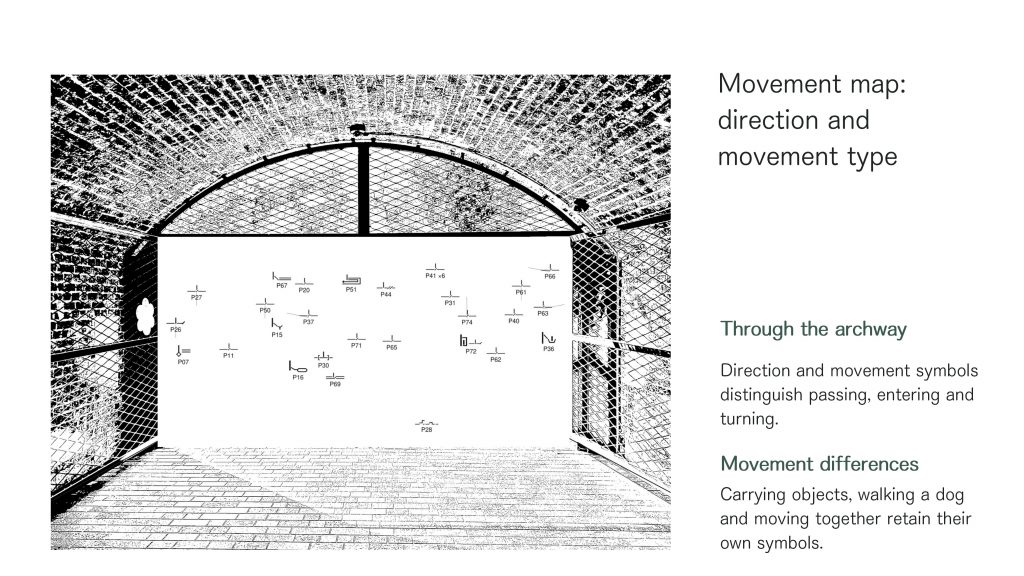
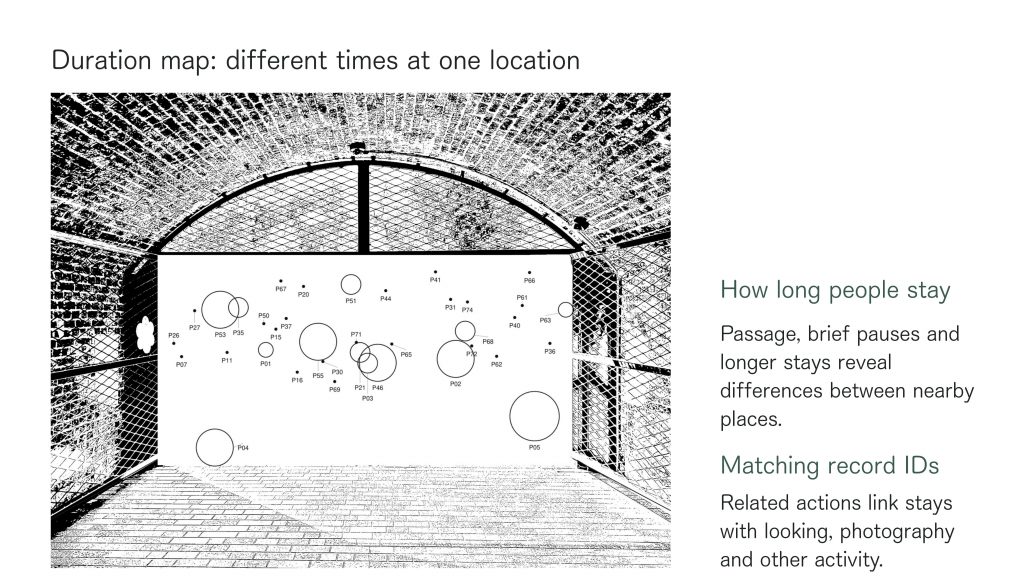
By 2 October, I had separated crowded field notes into three diagrams: movement, duration and specific actions. Information that overlapped in the notes could now be examined separately. For 9 October, I refined the symbols and diagrams and explored a higher viewpoint. Shared record numbers allowed the three diagrams to be read together.
Johanna Drucker’s ‘Designing graphic interpretation’ connects through form. She describes how multiple views can complement one another when shared elements make their relationships explicit (Drucker, 2014, p. 188). Applying her idea about digital environments to my static diagrams helped me understand the significance of layering: each view highlights a different question from the same set of observations. Separating information alone does not explain its relationships; shared record numbers make the connections traceable. Together, these layers help me understand how people use the space, including what they do when they stop.
The 9 October feedback extended this approach by asking how the symbols might support rapid recording during observation. My tutor suggested I continue exploring the hand-drawn style of Dear Data (Lupi and Posavec, n.d.). My next step is to develop this direction by sketching and testing if my symbols can keep up with the actual speed of the events.
Perec helps me notice details I might otherwise overlook, while Drucker helps me organise these observations in linked diagrams. Together, they help me see how notation can make temporary uses of the space readable by linking what I notice on site with how I present it.
References
Course in Scottish Country Dancing diagrams (2012) [Online course slides], 25 October. Available at: https://www.rscds-bhs.org.uk/file/20121025oslo/Course.html/index.html (Accessed: 13 October 2026).
Drucker, J. (2014) Graphesis: Visual forms of knowledge production. Cambridge, MA: Harvard University Press.
Lupi, G. and Posavec, S. (n.d.) The project. Dear Data. Available at: https://www.dear-data.com/theproject (Accessed: 13 October 2026).
Perec, G. (1999) Species of spaces and other pieces. Translated by J. Sturrock. Revised edn. London: Penguin Books.