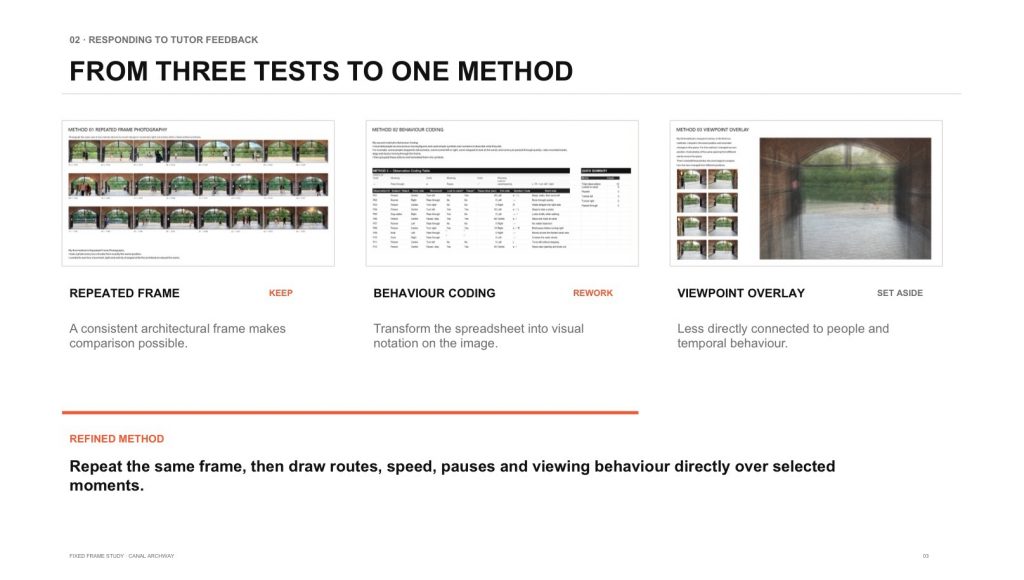
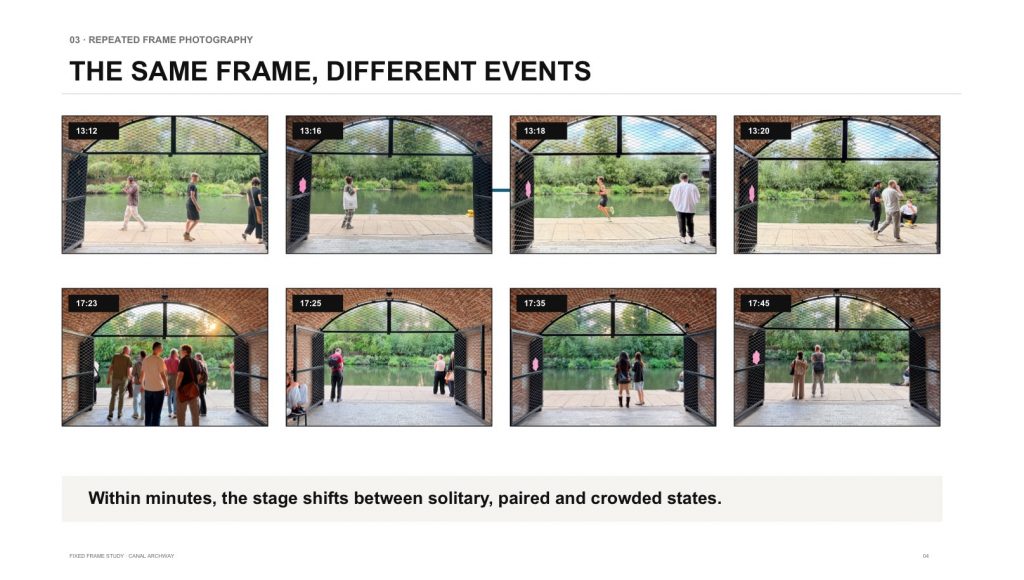
Following my initial experiments, I focused on behavioural coding to investigate how people moved through and paused around the canal archway.
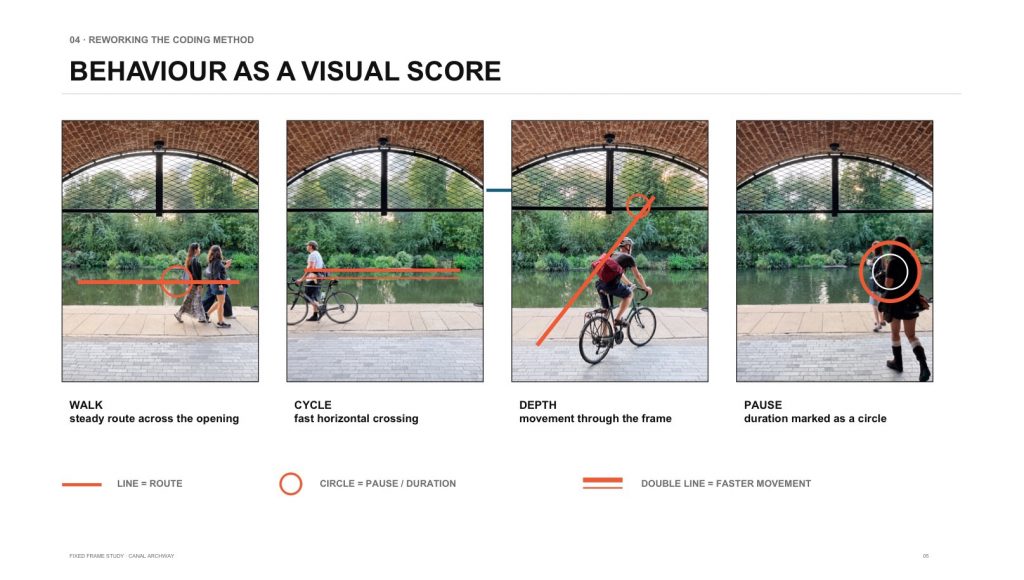
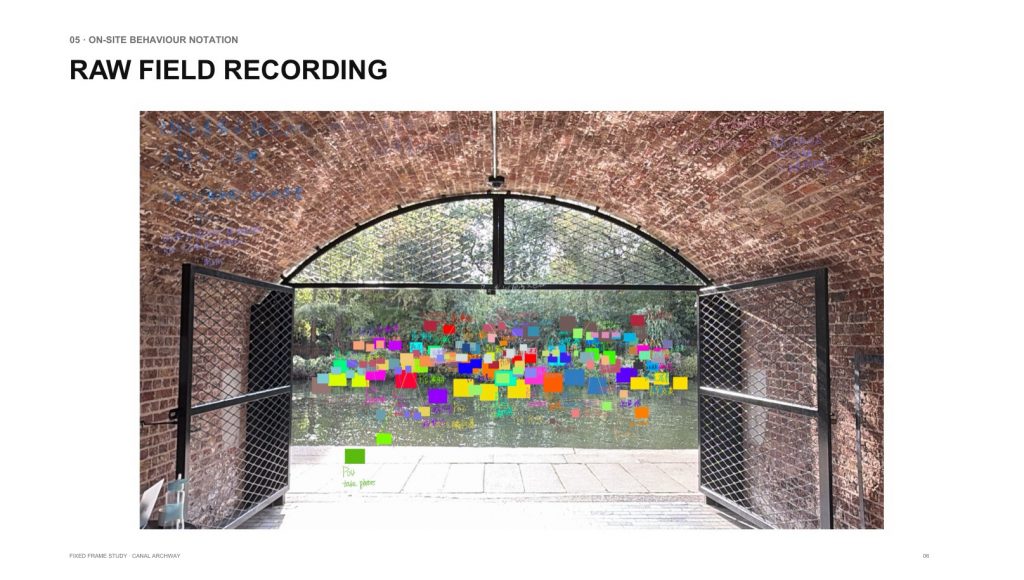
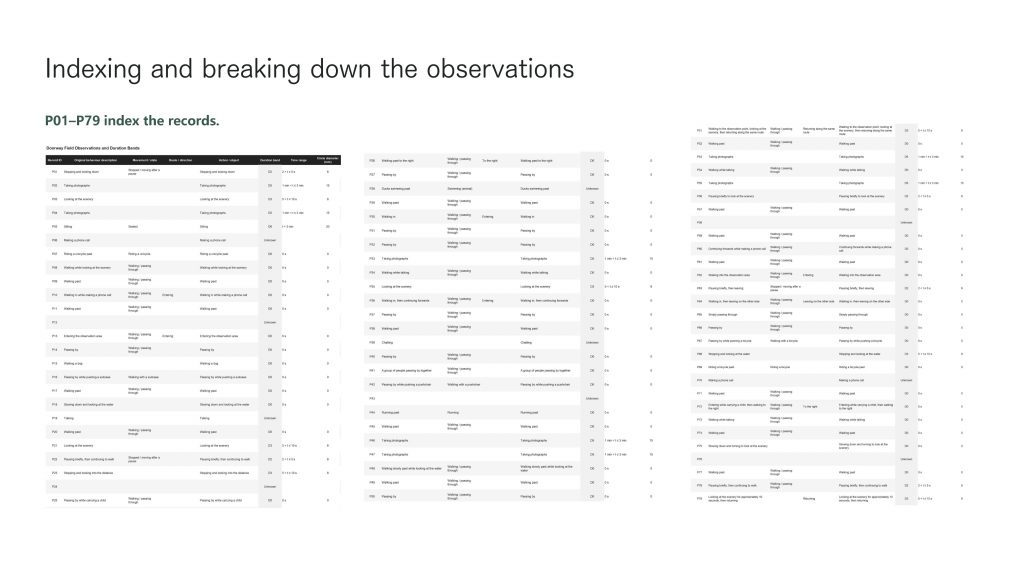
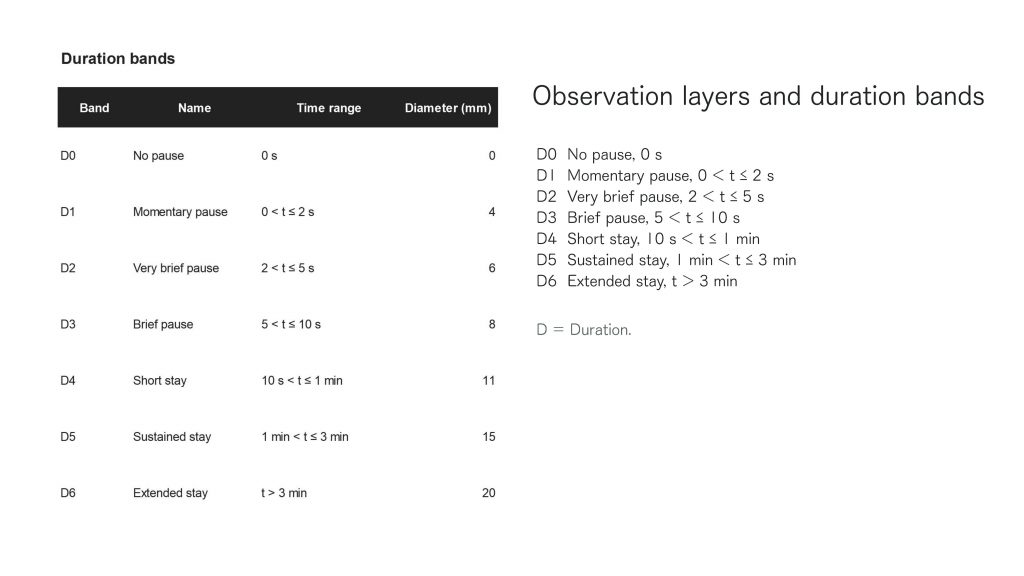
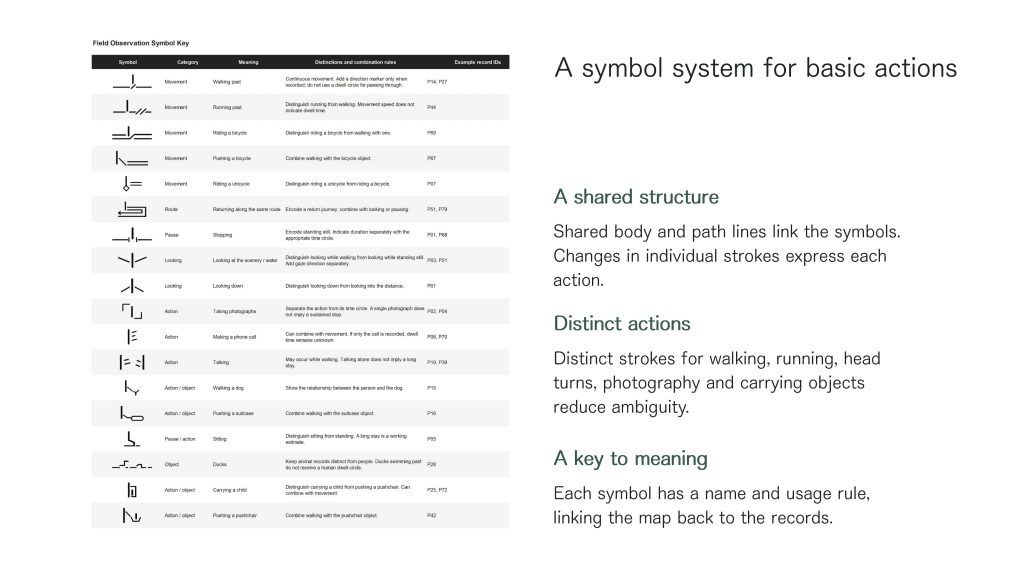
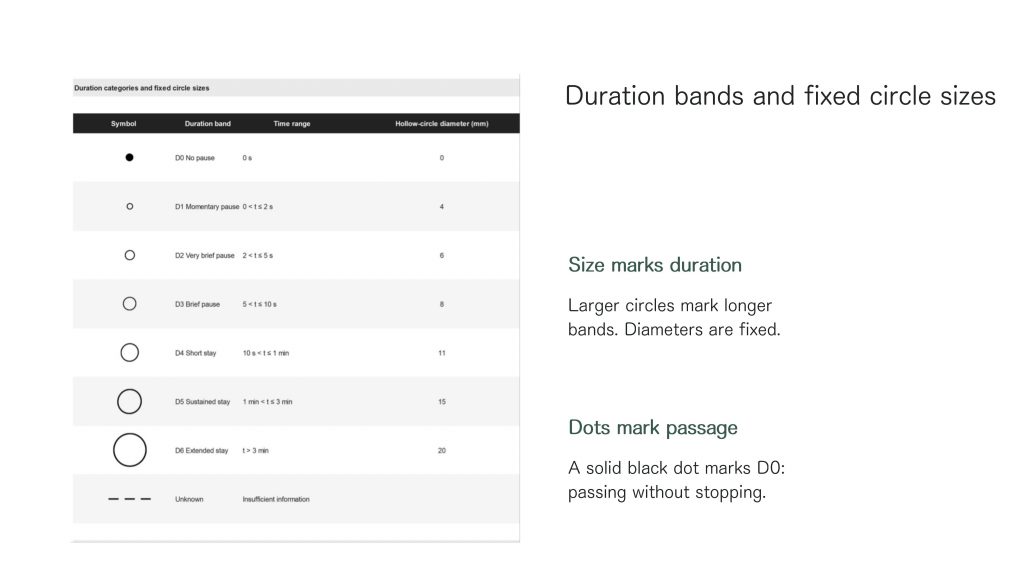
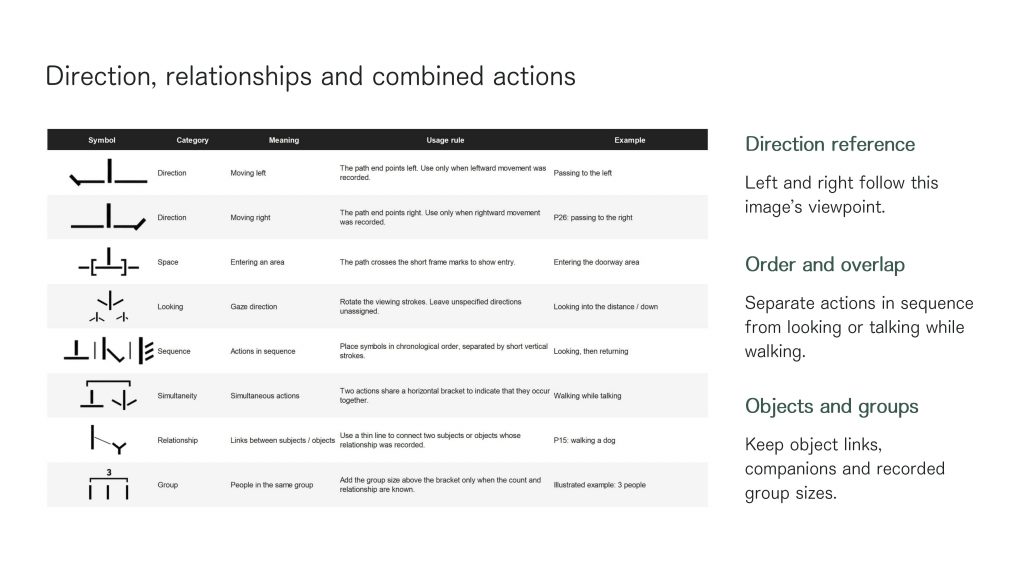
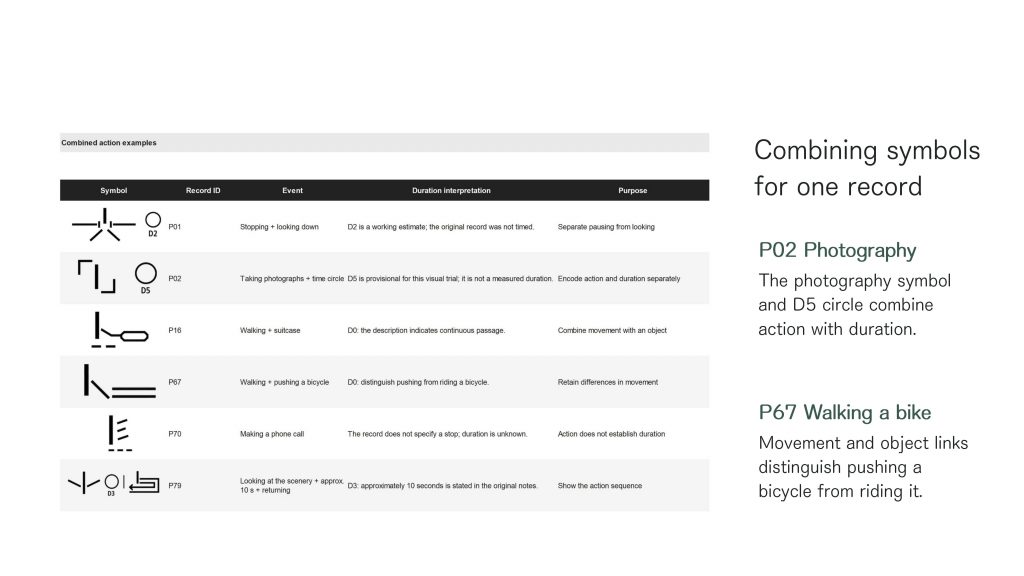
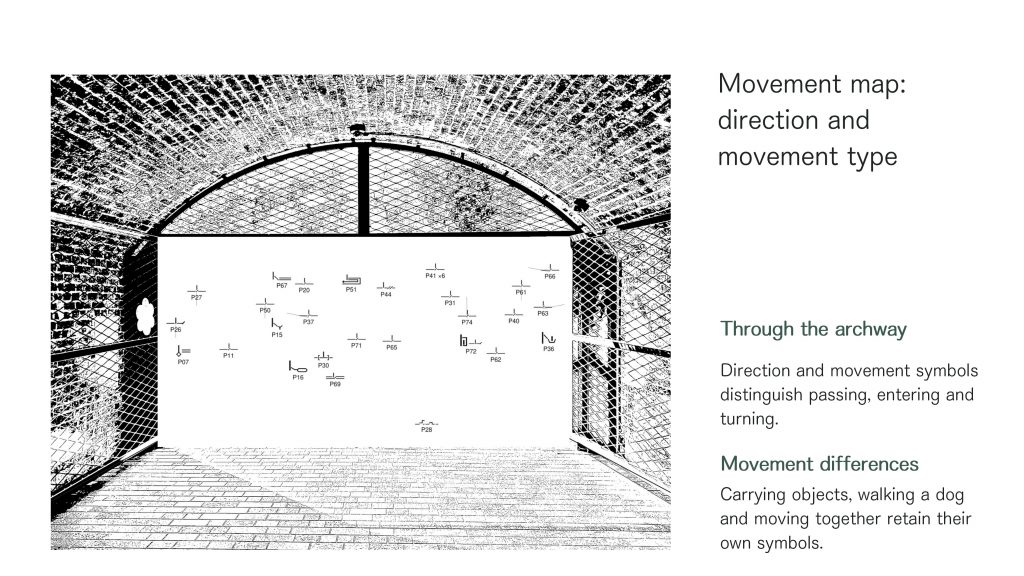
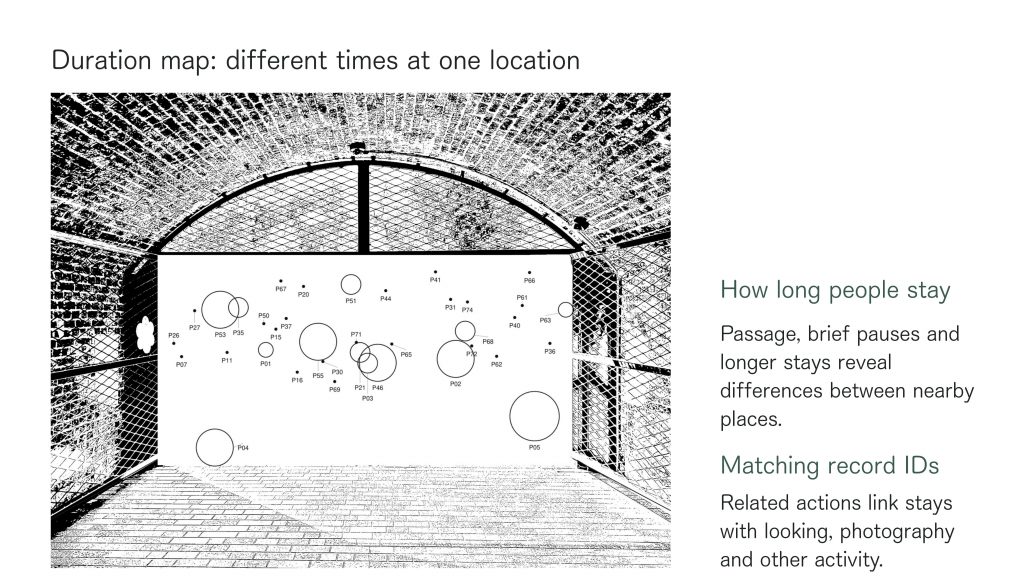
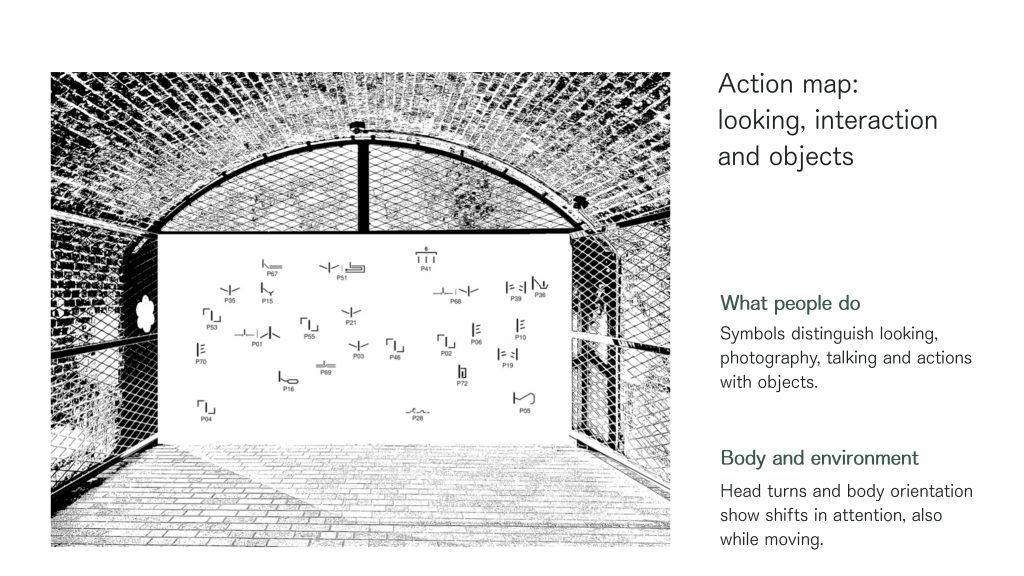
For the 2 October tutorial, I translated my handwritten observations into an initial symbol system. As my fieldwork drawing was crowded and difficult to read, I organised the information into three separate diagrams: a Movement Map, a Duration Map and an Action Map. These recorded how people moved, how long they stayed and what they did.
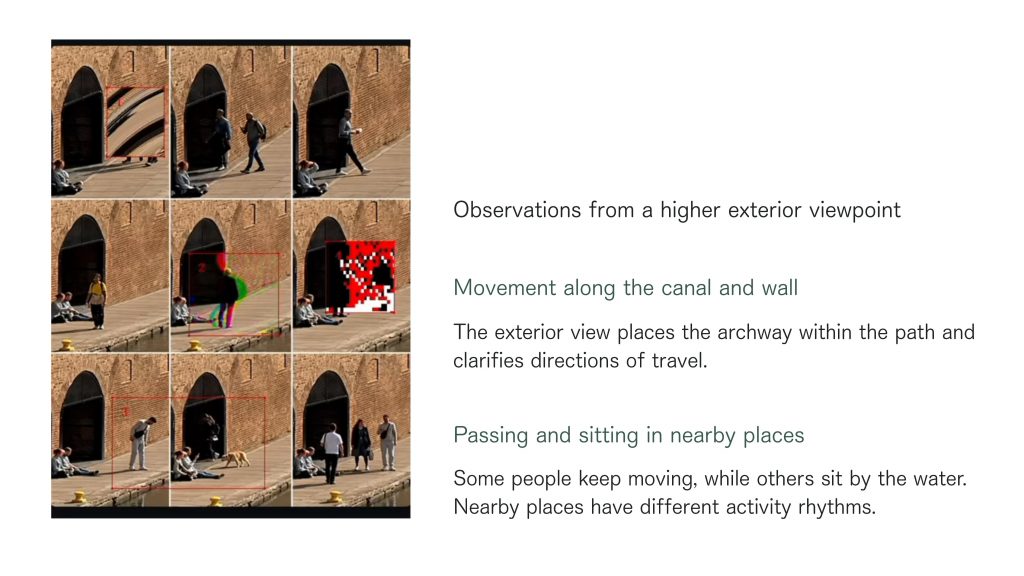
For the 9 October tutorial, I refined the symbols and reorganised the diagrams to make the different layers easier to compare. I also explored the site from a higher viewpoint and carried out further visual experiments to better understand its spatial context.
The images below document the work presented on 2 and 9 October. I have kept the first four slides from 2 October, followed by the revised maps and additional experiments from 9 October. For the Movement Map, Duration Map and Action Map, I have included only the revised versions to avoid repetition.
2 October — Initial notation system
9 October — Revised notation system
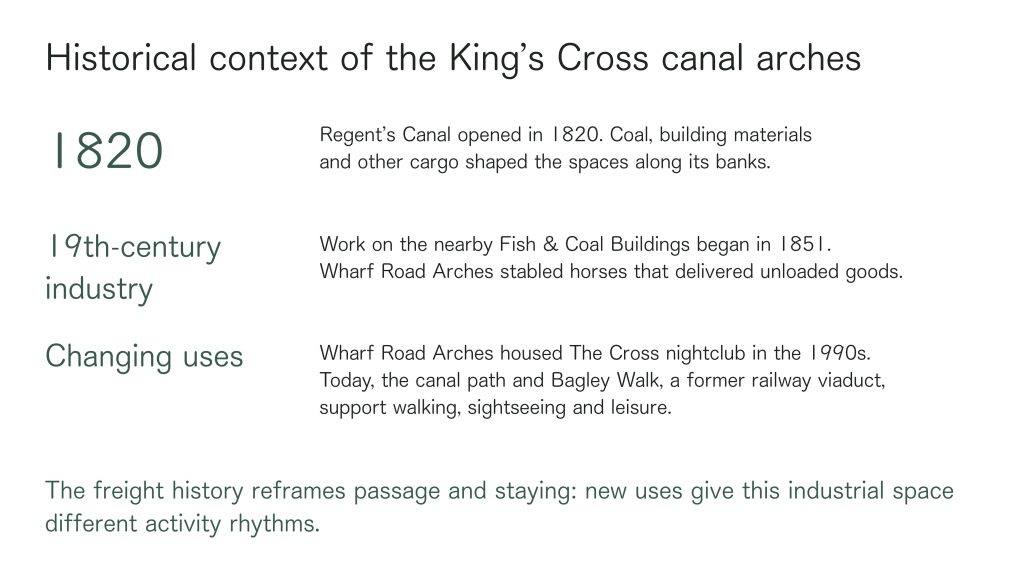
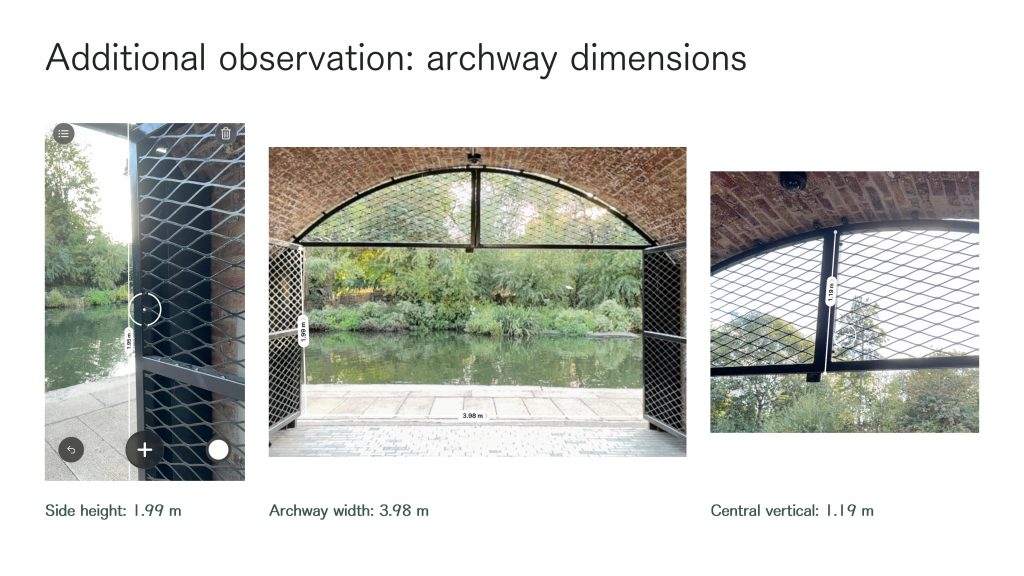
Site Context — History and Measurements
Leave a Reply